Tennessee graduated 92.3% of its high school seniors on time in 2025, the highest rate in the state's history and the second consecutive year setting a new record after crossing the 90% threshold for the first time in 2023. The figure would be easy to dismiss as incremental progress — a fraction of a point above last year's 92.1% — except for one detail that makes the achievement harder to wave away: the state did it with a bigger graduating class.
The 2025 cohort numbered 74,865 students, up 1,829 from the prior year, a 2.5% increase. Of those, 69,124 earned diplomas on time. That means Tennessee didn't just graduate a higher share of a smaller pool. It graduated 1,892 more students than the year before from a larger one.
Four years of sustained improvement
The trajectory since the pandemic tells a story of sustained, if unspectacular, improvement. Tennessee's graduation rate bottomed at 88.7% in 2021 — the class that entered high school the same fall COVID shuttered buildings. Unlike many states that saw their rates spike during the pandemic years thanks to waived requirements and automatic promotion, Tennessee held the line on graduation standards. The rate dipped while other states' numbers surged.
That makes the four-year climb from 88.7% to 92.3% worth taking seriously. Each year's gain has been modest — about a point per year — but the consistency is rare. And because the baseline was never artificially inflated, the improvement represents real movement, not a return to a padded norm.
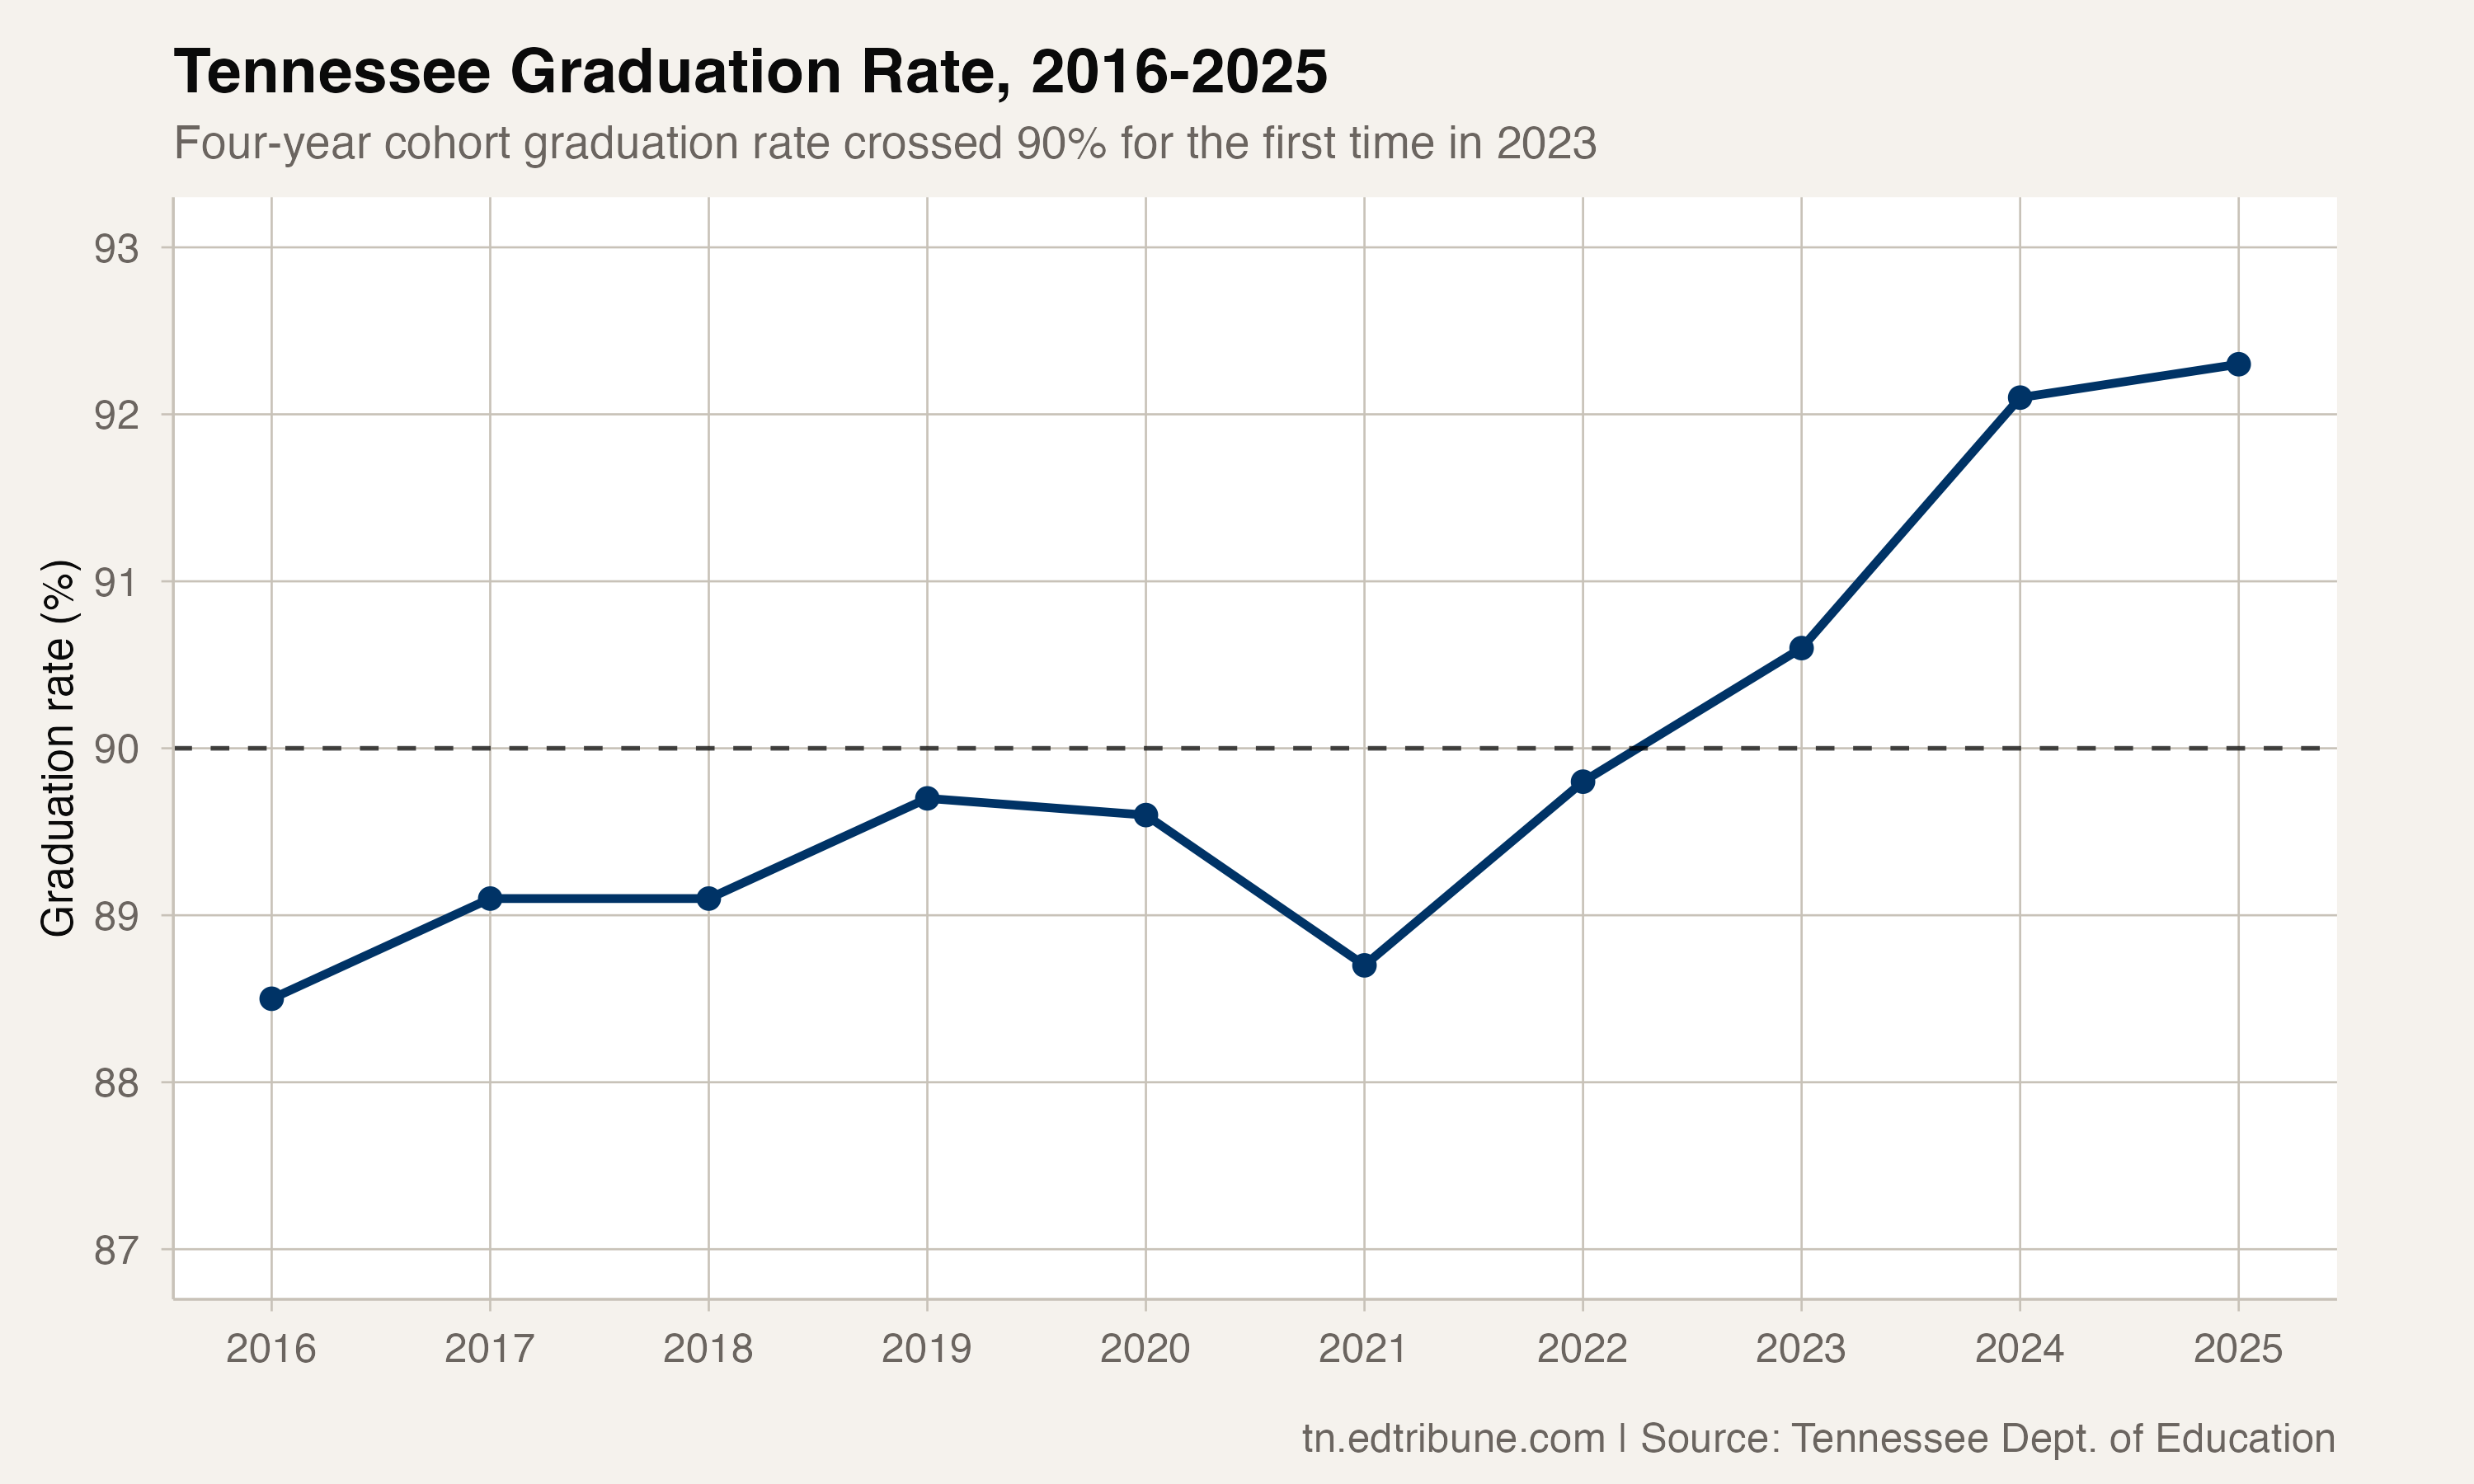
The path from 2016 to 2025 shows a state that started at 88.5%, took three years to crack 89%, stalled during COVID, and then climbed more steeply than at any point in the data window. The rate has improved 3.8 percentage points since 2016, with nearly all of that gain concentrated in the last four years.
A growing denominator
National conversations about rising graduation rates often carry an asterisk: are more students graduating, or are fewer students showing up? In Tennessee, the answer is unambiguous.
The graduation cohort grew from 71,379 in 2016 to 74,865 in 2025, adding 3,486 students over the decade. The number of actual graduates grew even faster — from 63,194 to 69,124, an increase of 5,930 diplomas. The gap between those two numbers is the improvement: a higher percentage of a bigger pool.
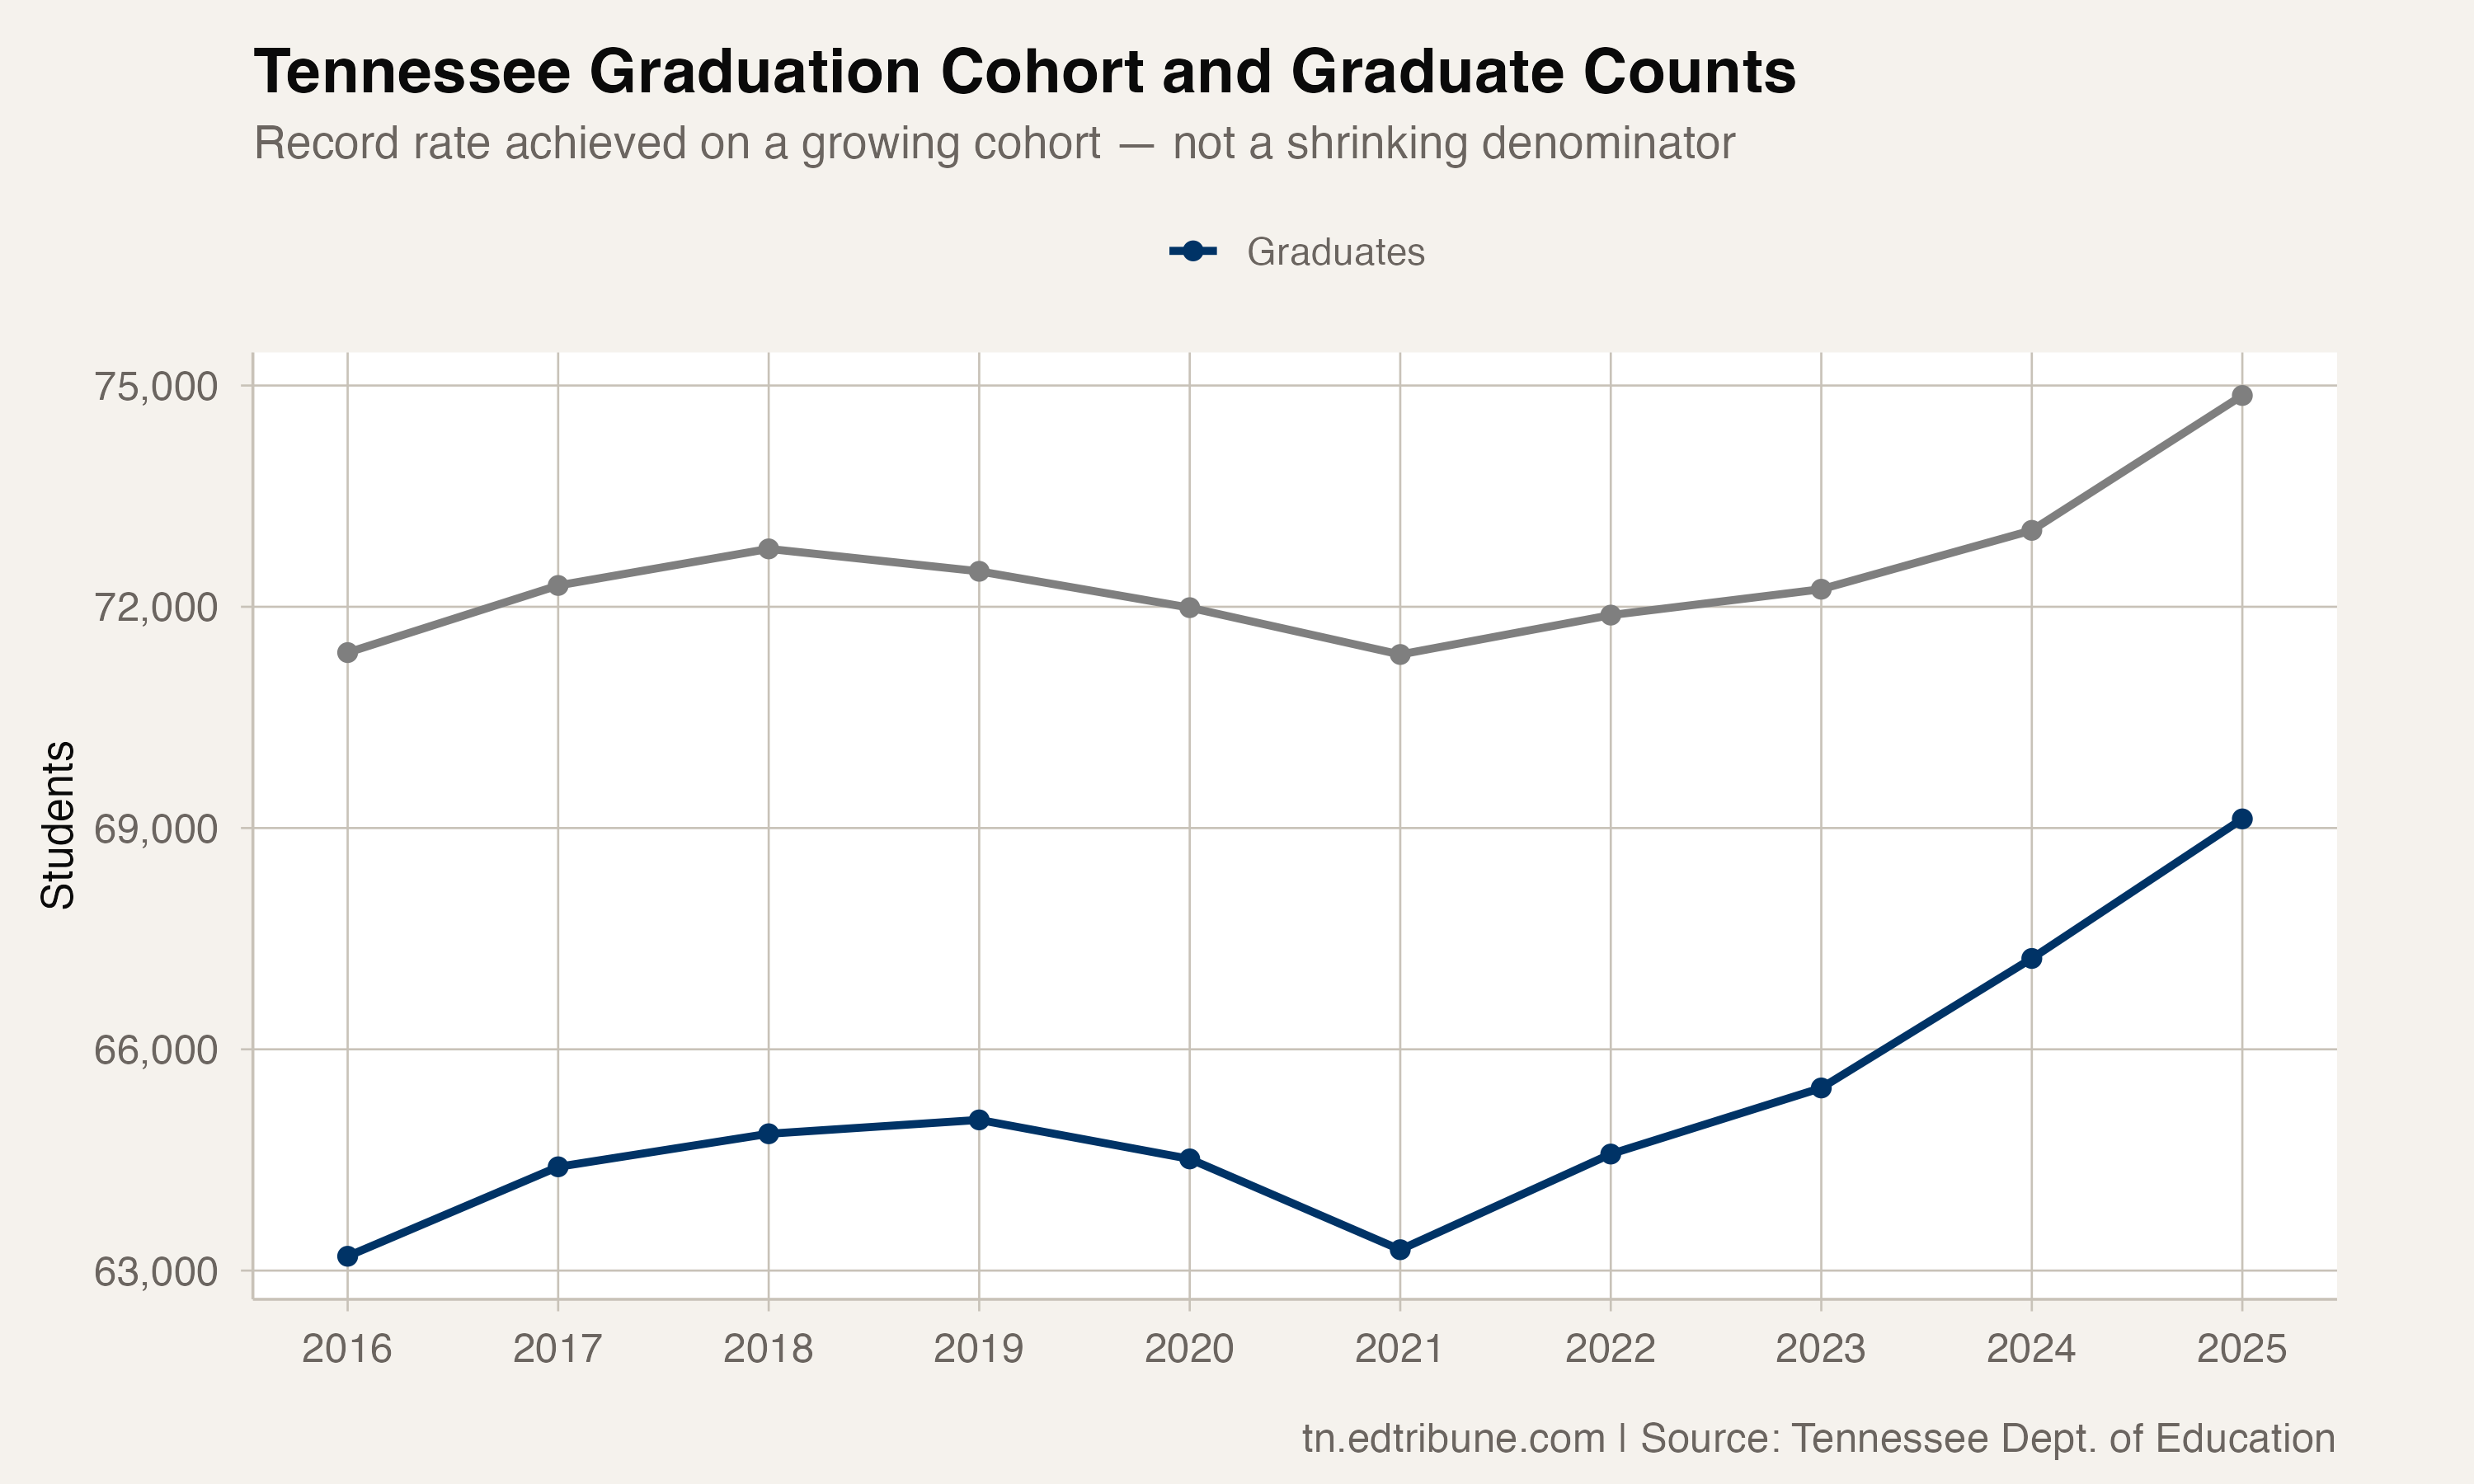
The 2025 cohort increase of 1,829 students was the largest single-year jump in the data window. Much of that growth came from Tennessee's rapidly expanding Hispanic population — the Hispanic graduation cohort has nearly tripled from 4,435 to 12,202 since 2016.
What the district map shows
At the district level, the state's success is broad but uneven. Seventy-three of Tennessee's 131 districts now graduate 95% or more of their students on time — more than half the state. Forty-one districts set all-time highs in 2025.
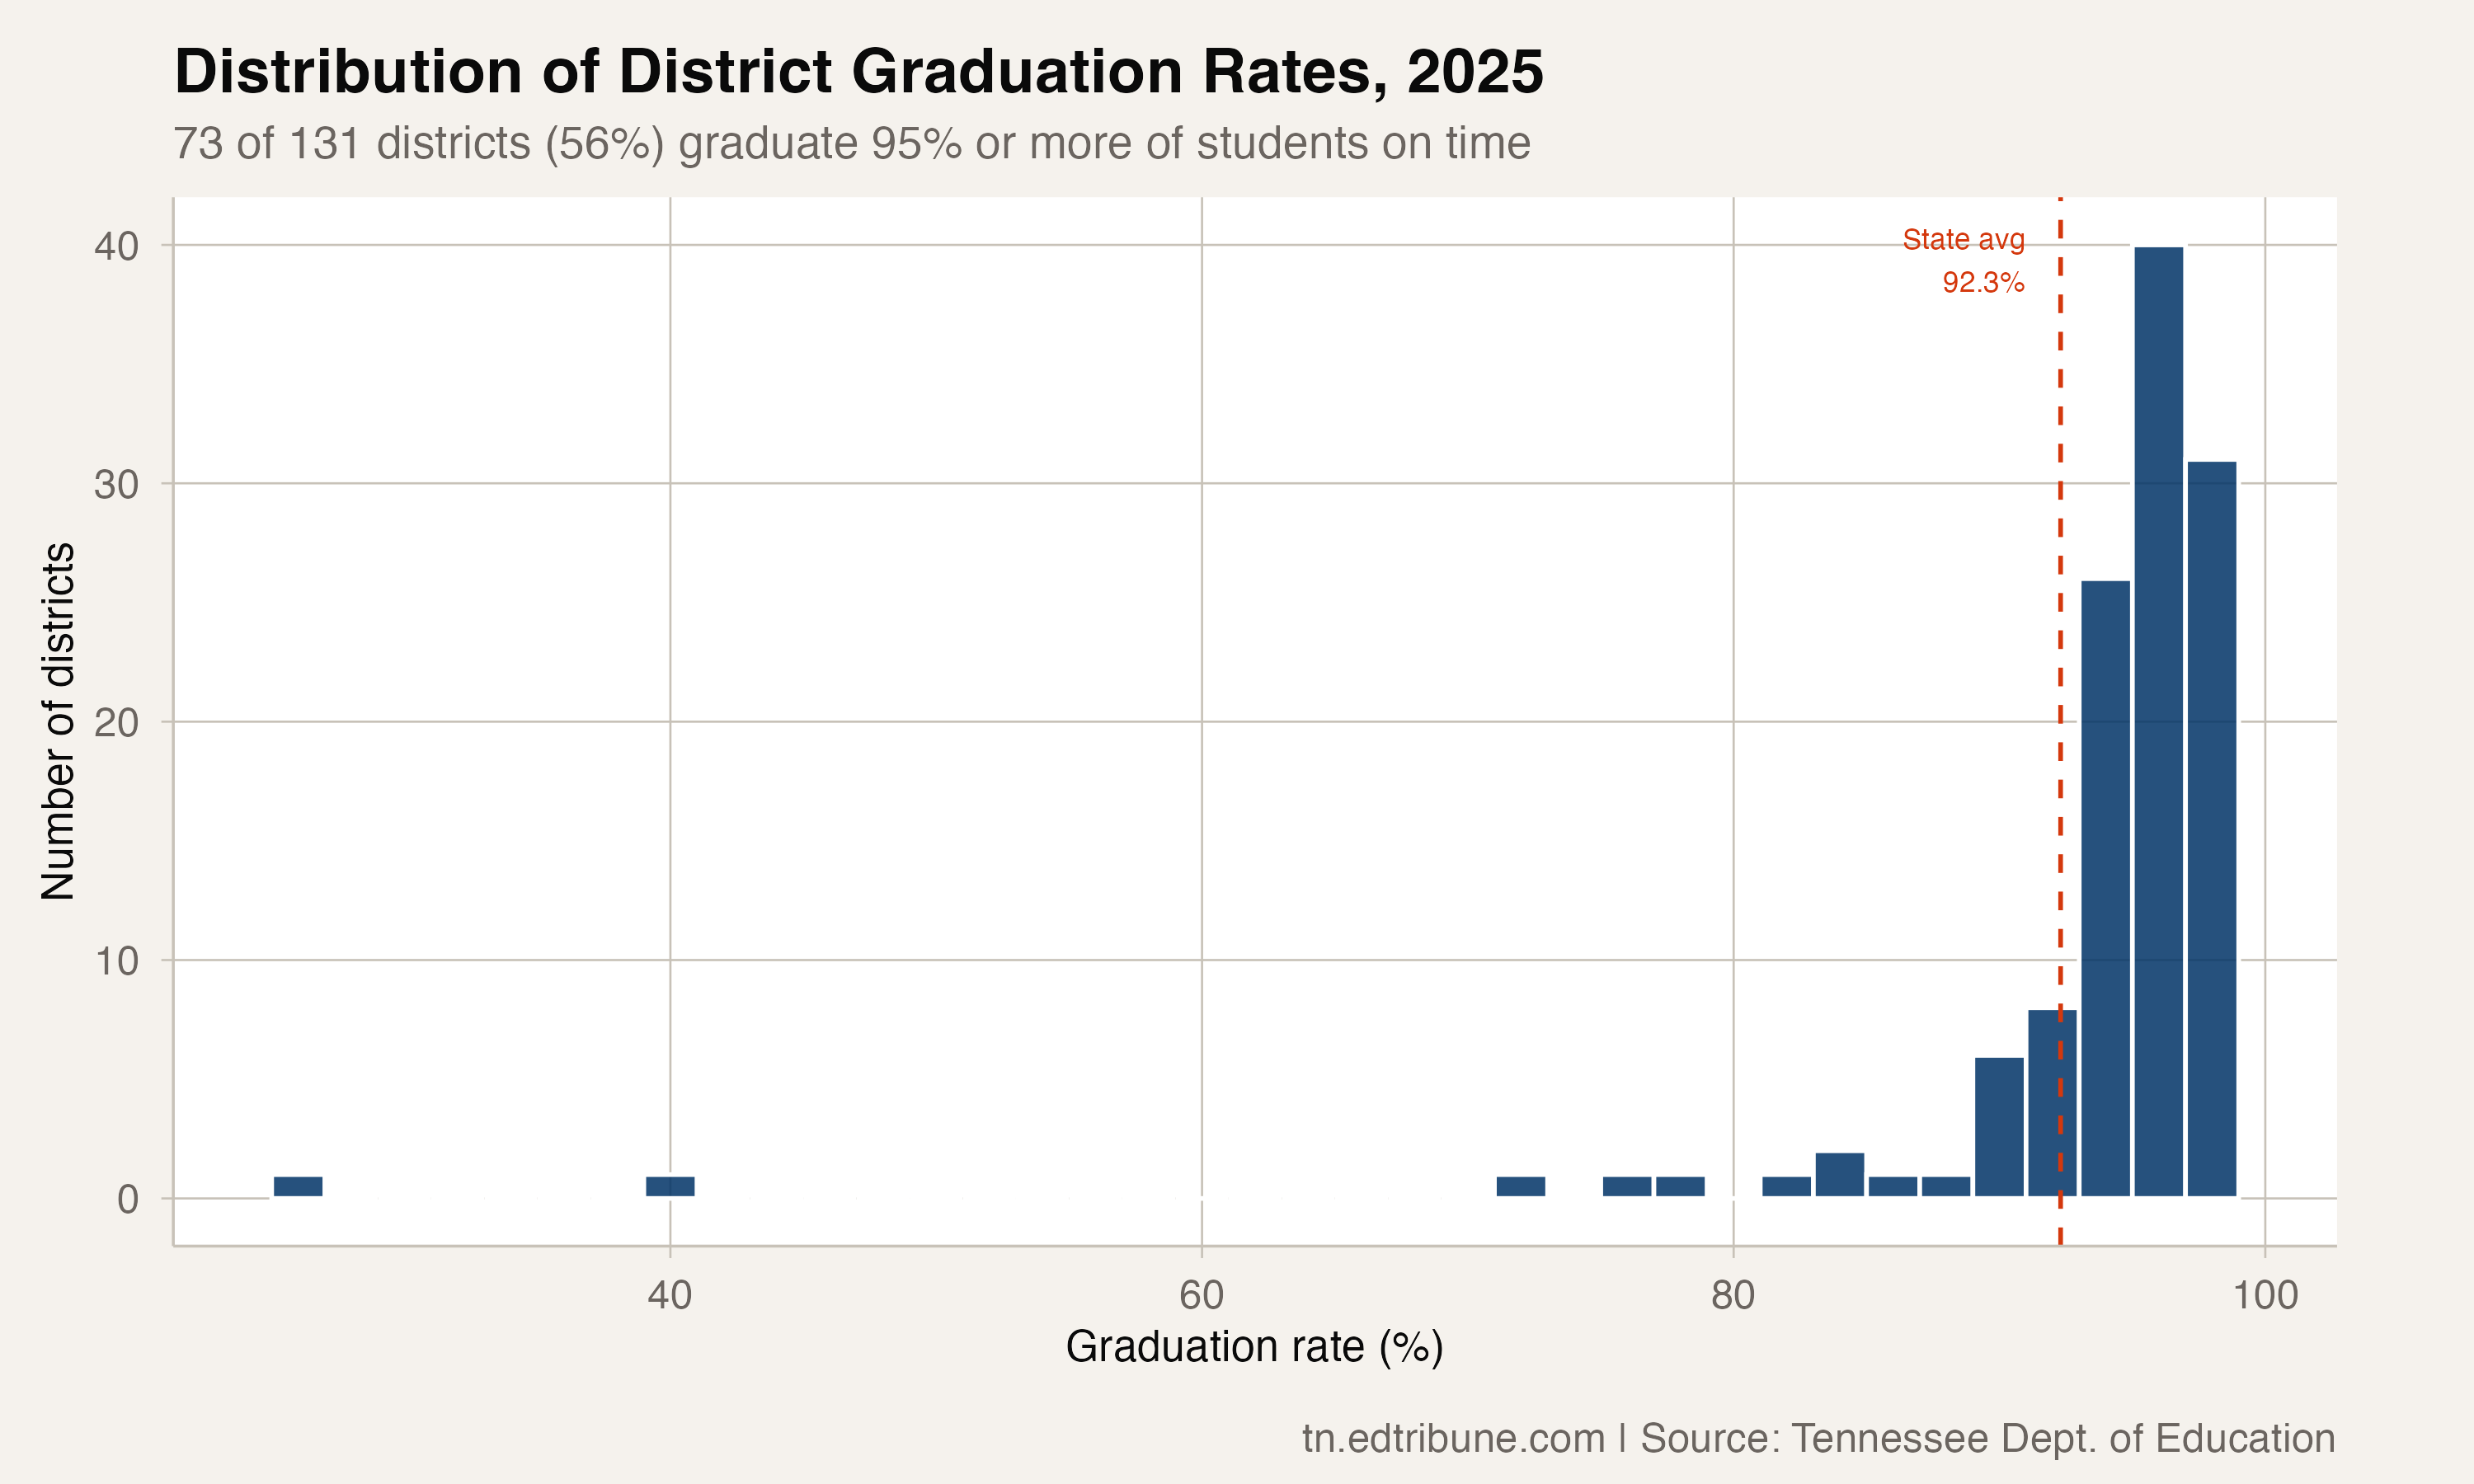
The distribution is heavily right-skewed: most districts cluster in the 90s, with a long tail stretching down to the Achievement School District at 40.9% and the DCS Education Division at 26.0%. The three largest urban districts — Memphis-Shelby County at 84.4%, Davidson County (Nashville) at 83.6%, and Hamilton County (Chattanooga) at 94.2% — represent a range of outcomes that will be explored in detail throughout this series.
The year-over-year picture
The four-year improvement streak stands out against a pre-pandemic period of relative stasis. From 2016 to 2019, the state gained 1.2 points total. Since 2021, it has gained 3.6.
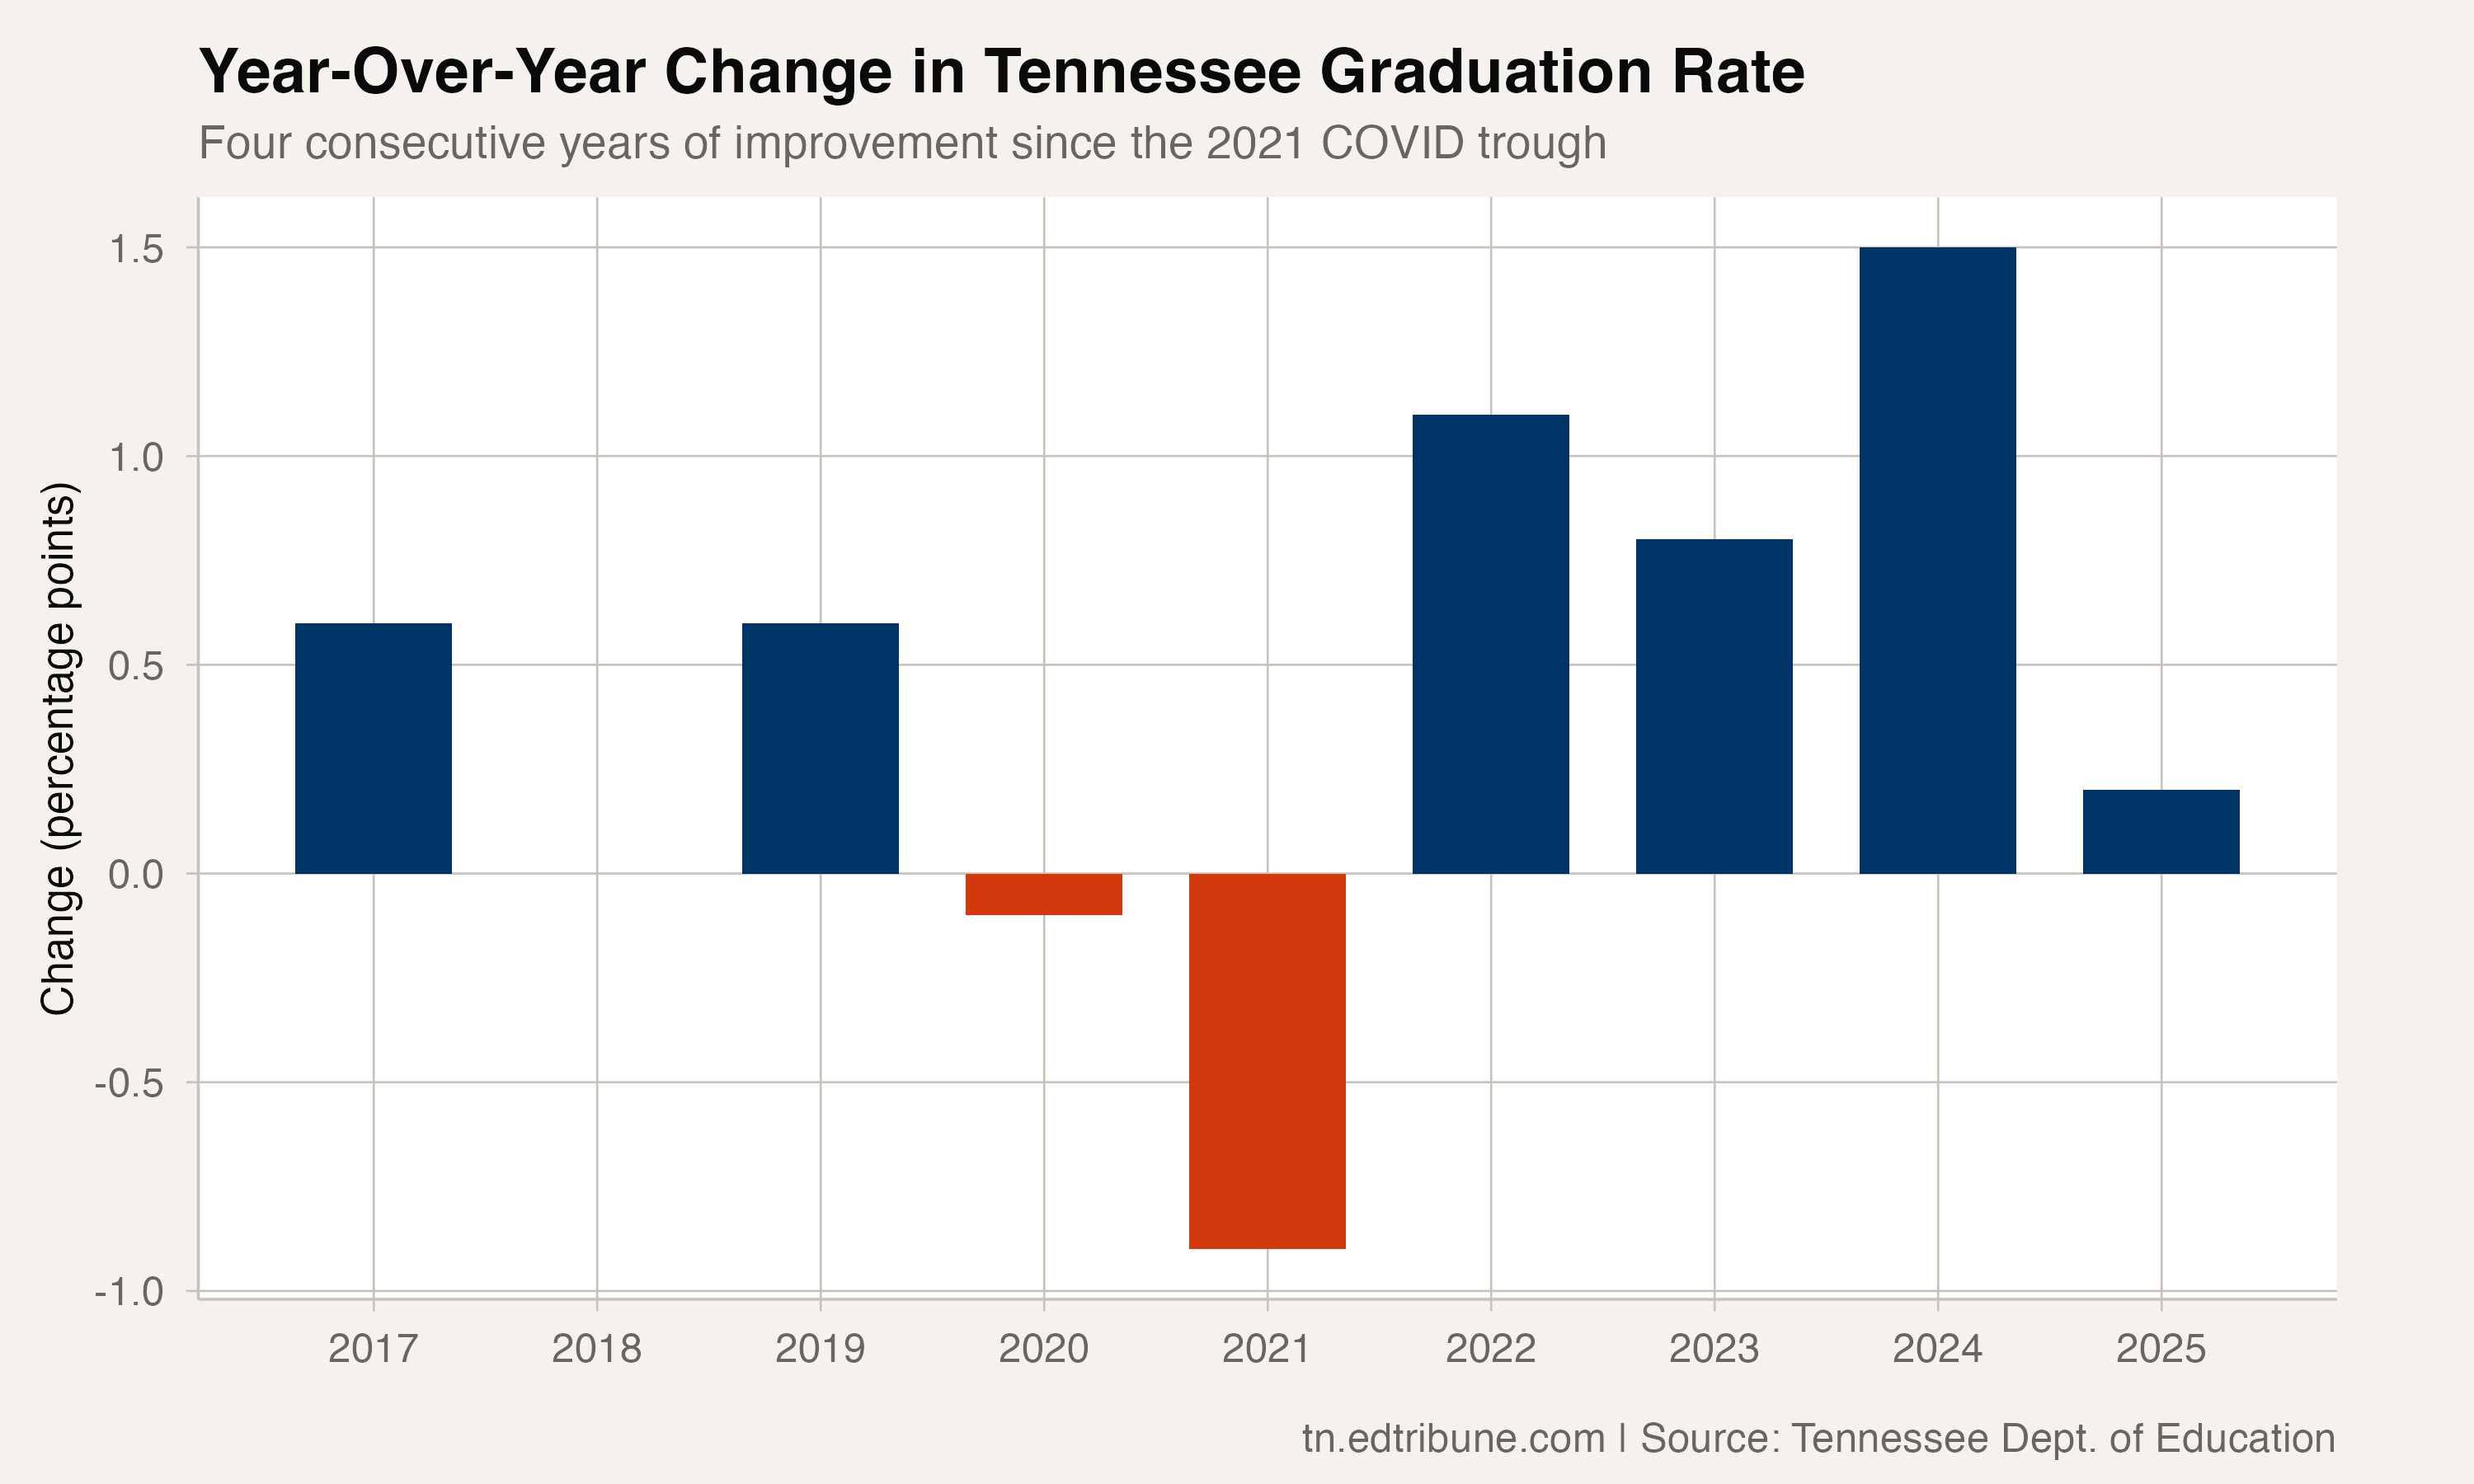
The 2020 and 2021 dips were modest — less than a point each — but they were real, not artifacts. Tennessee maintained its graduation requirements through COVID, meaning students who didn't meet them didn't graduate. The post-pandemic surge reflects genuine recovery and then some.
What the numbers do not say
A 92.3% rate means that roughly 5,741 students in the 2025 cohort did not earn a diploma on time. The state does not publish a 5-year extended rate, so it is unclear how many of those students eventually graduate. It does not break out diploma types, so there is no way to distinguish between a standard diploma and various alternative pathways from this data alone.
The rate also masks the enormous variation by subgroup. The white graduation rate is 95.1%. The Black rate is 89.3%. For economically disadvantaged students, it is 88.3%. For students with disabilities, 84.2%. For English learners, 78.6%. And for youth in foster care, 56.9%.
Those gaps — some closing rapidly, others stubbornly persistent — are the subject of the articles that follow.
Tennessee graduation rate data comes from the Tennessee Department of Education. Analysis covers the 2015-16 through 2024-25 school years (10 cohorts). All rates are 4-year adjusted cohort graduation rates.
Detailed code that reproduces the analysis and figures in this article is available exclusively to EdTribune subscribers.
Discussion
Sign in to join the discussion.
Loading comments...