Correction: An earlier version described the enrollment shares for recovered and non-recovered districts as statewide. The shares are calculated within the 142-district comparison group with data in both endpoint years.
Rutherford County, home to Murfreesboro and one of the fastest-growing suburbs in middle Tennessee, posted a chronic absenteeism rate of 4.2% in 2020-21. That year, one in 24 students was missing more than 10% of school days. By 2024-25, the rate had nearly tripled to 11.3%, one in nine students. Rutherford County still earns Level 5 status on Tennessee's accountability system, the state's highest mark. But it cannot get its attendance back to where it was.
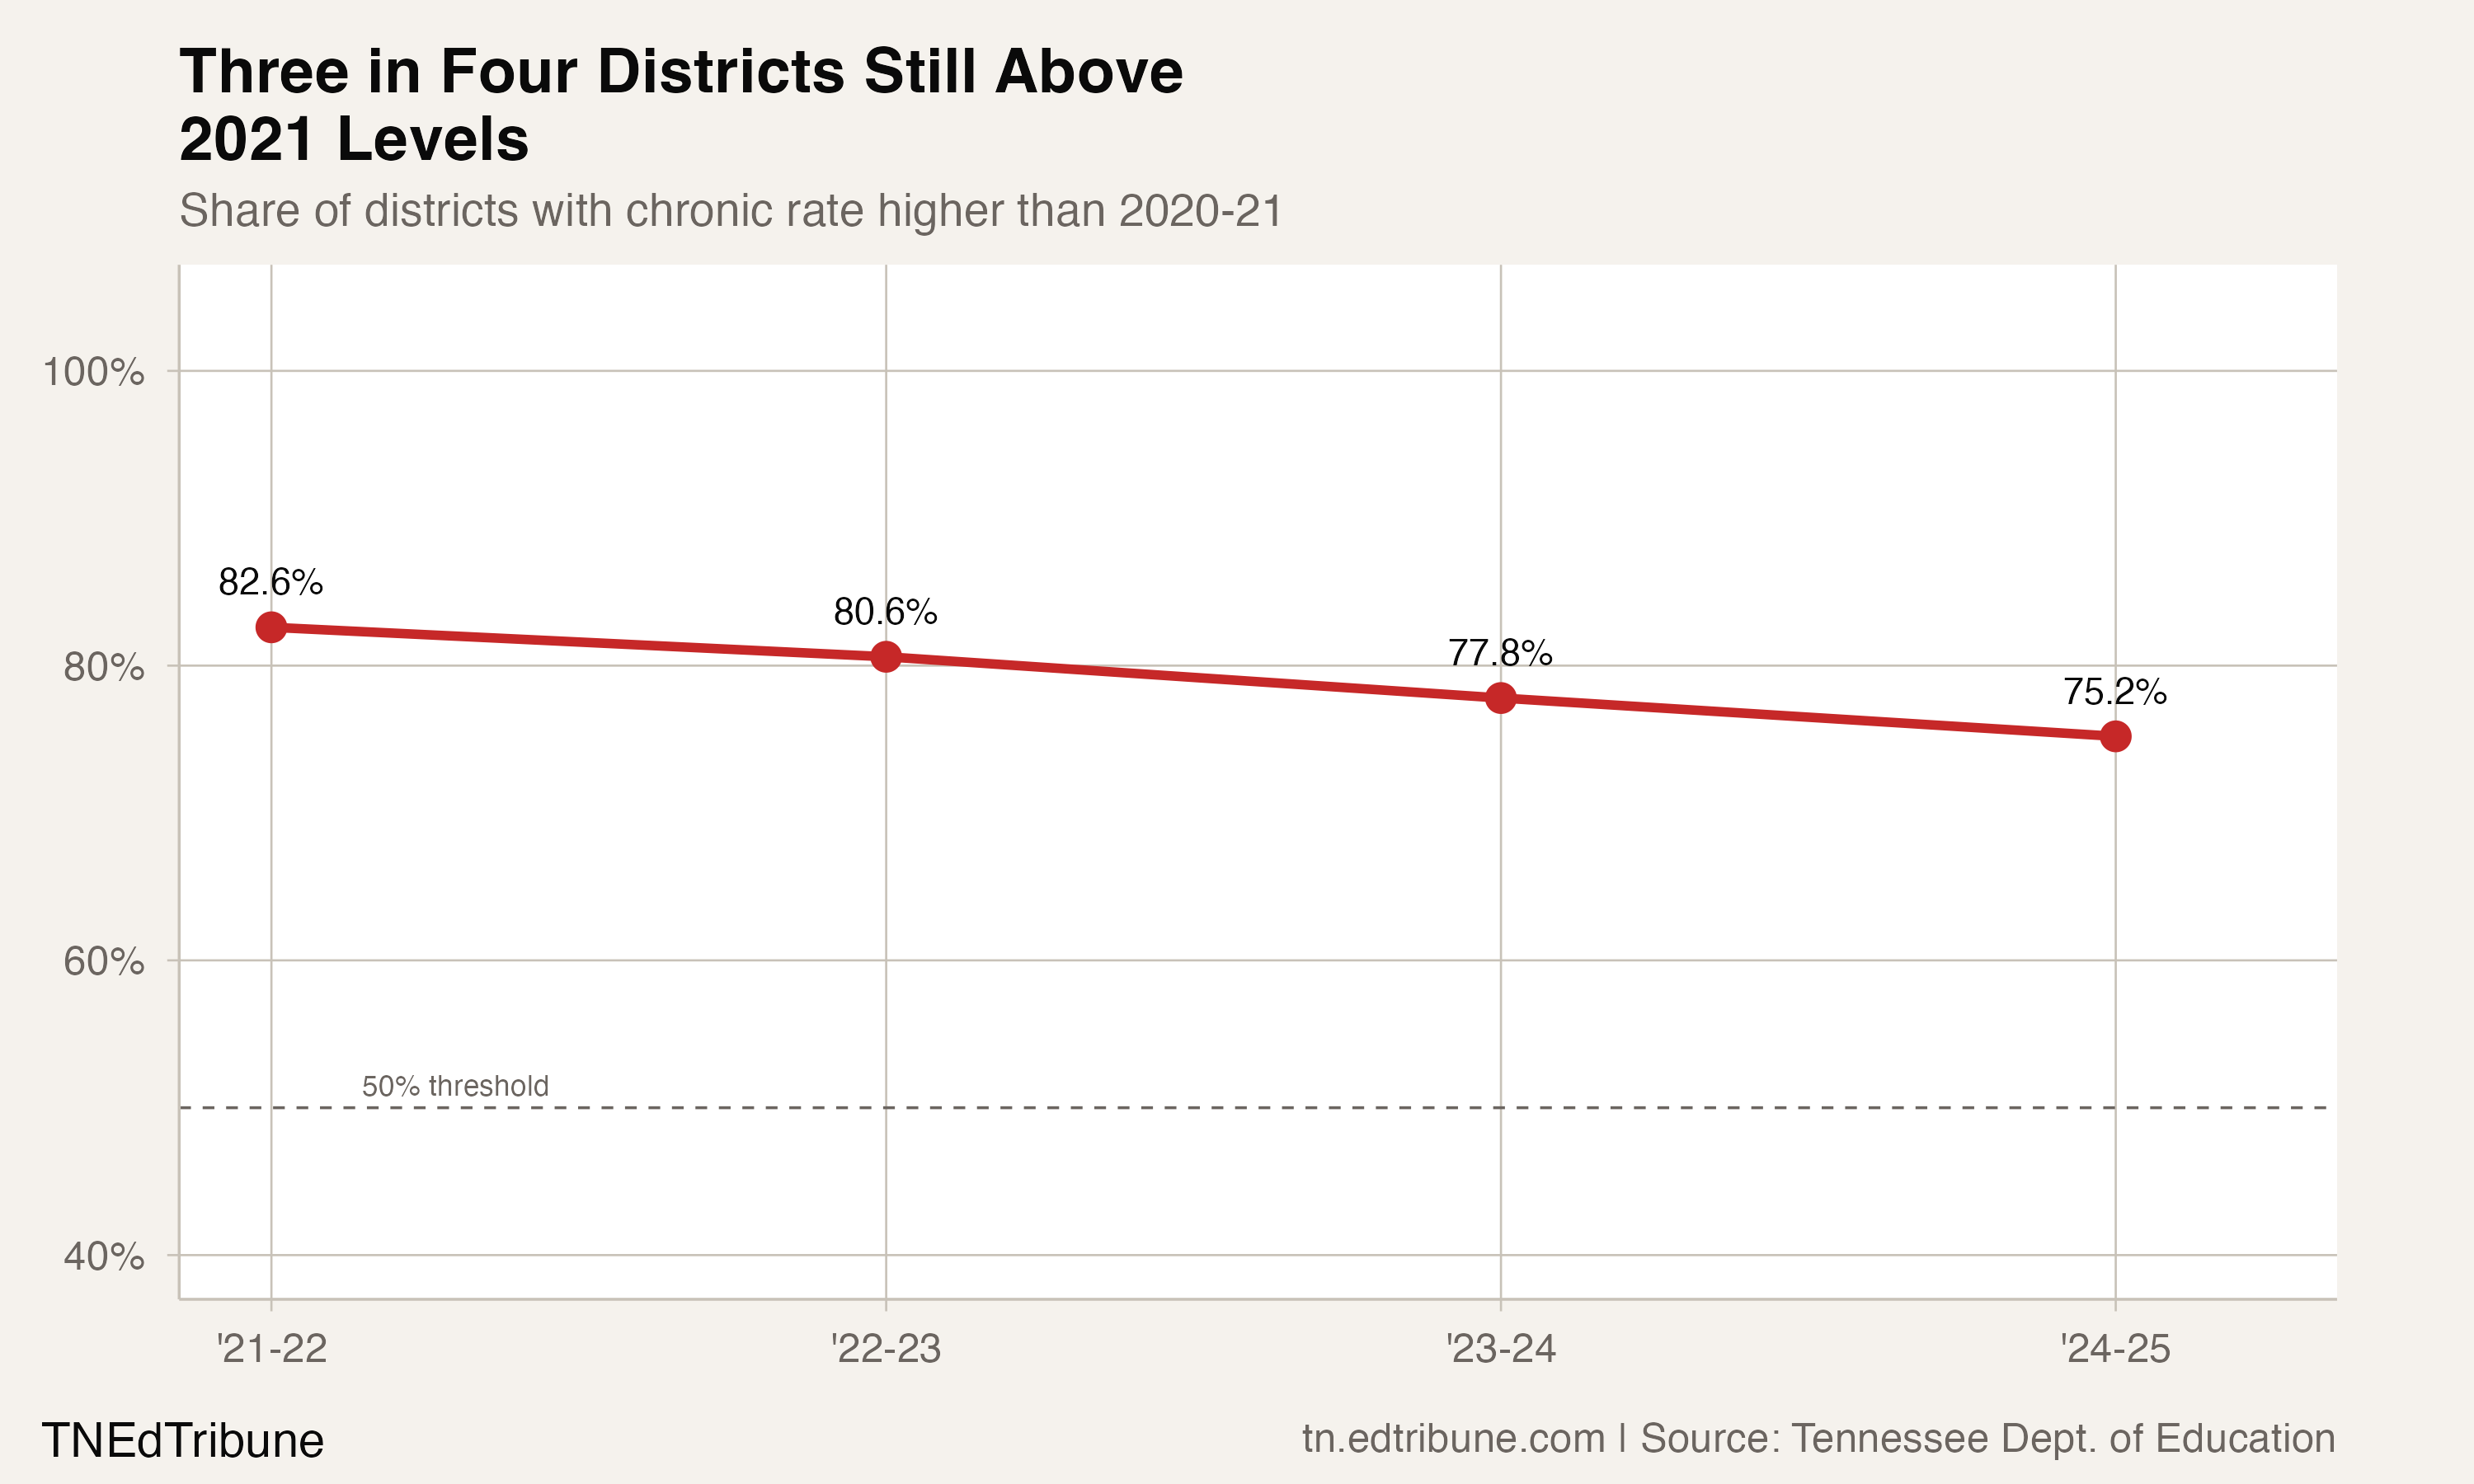
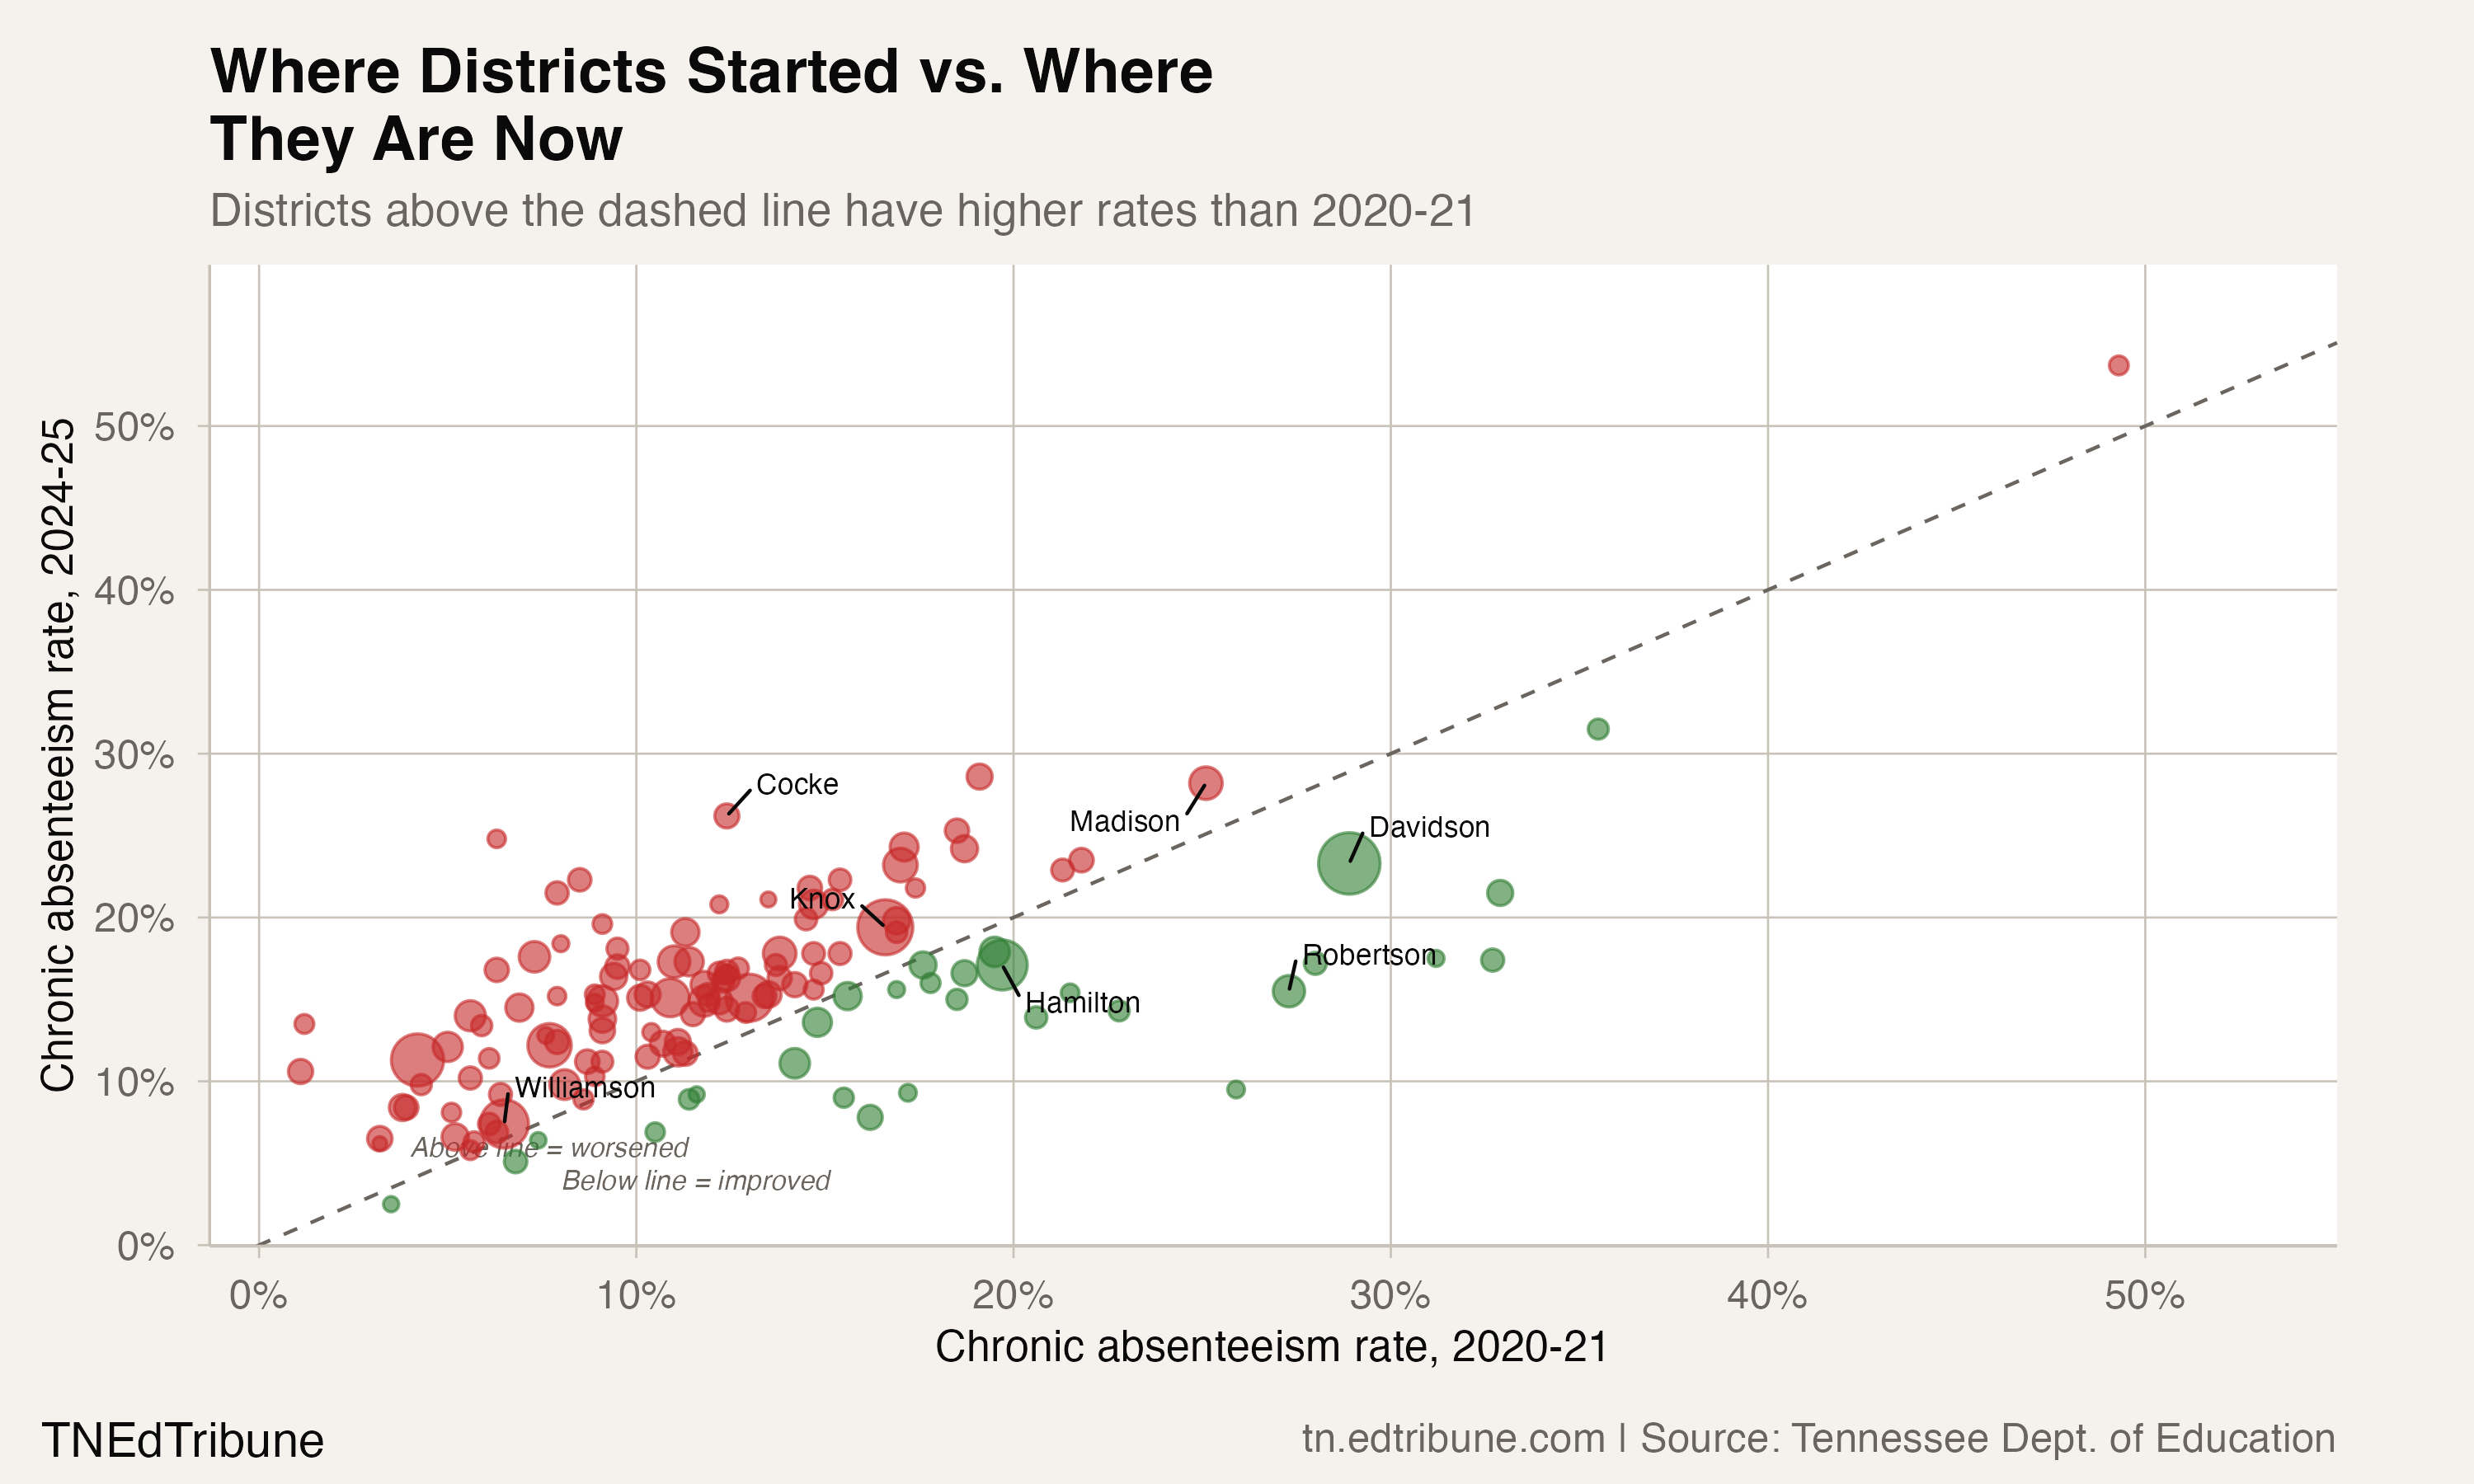
Rutherford is not unusual. It is typical. Across Tennessee, 107 of 142 districts with data in both years have chronic absenteeism rates higher today than in 2020-21. Only 35 districts, 24.6%, have recovered to their own baseline. The pandemic did not temporarily spike attendance problems. In three out of four Tennessee communities, it reset them.
Not a Memphis problem
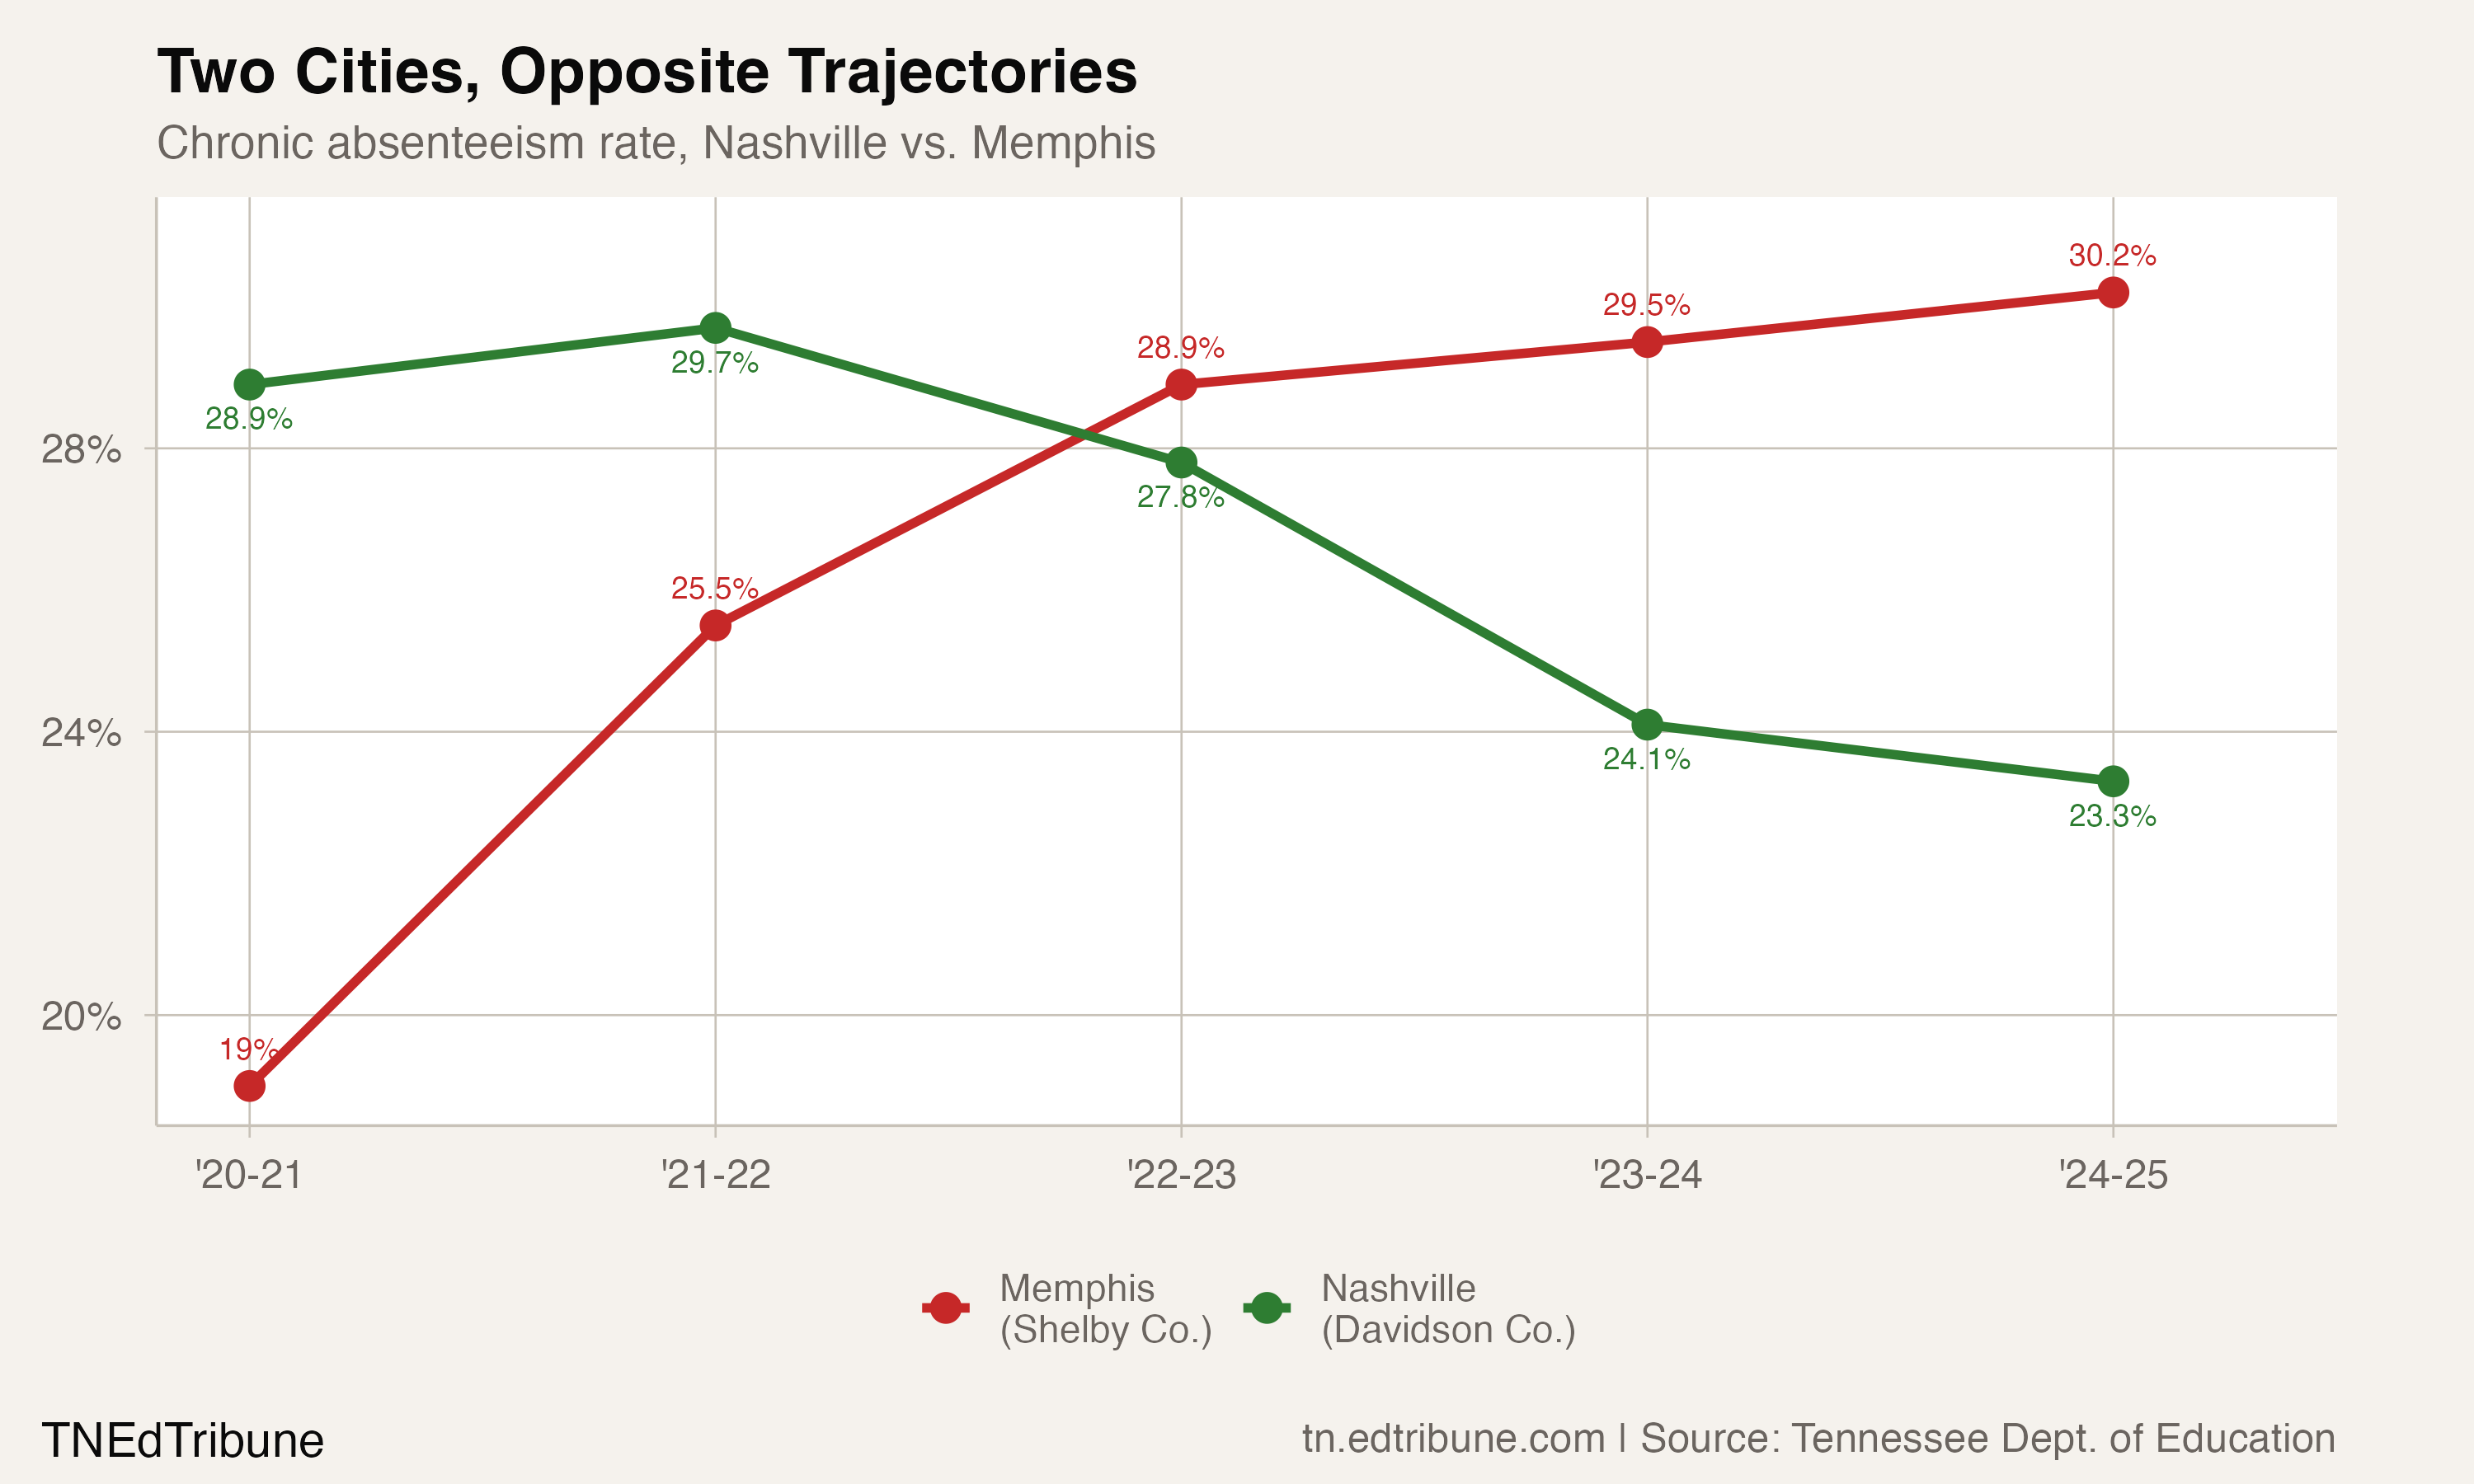
The instinct is to point at Memphis-Shelby County Schools, the state's largest district, which has seen its chronic absenteeism rate climb every year in the data: 19.0% to 25.5% to 28.9% to 29.5% to 30.2%. That four-year escalation of 11.2 percentage points is the worst among major districts and accounts for 31,785 chronically absent students, 17.6% of the statewide total from a district enrolling roughly 10% of the state's students.
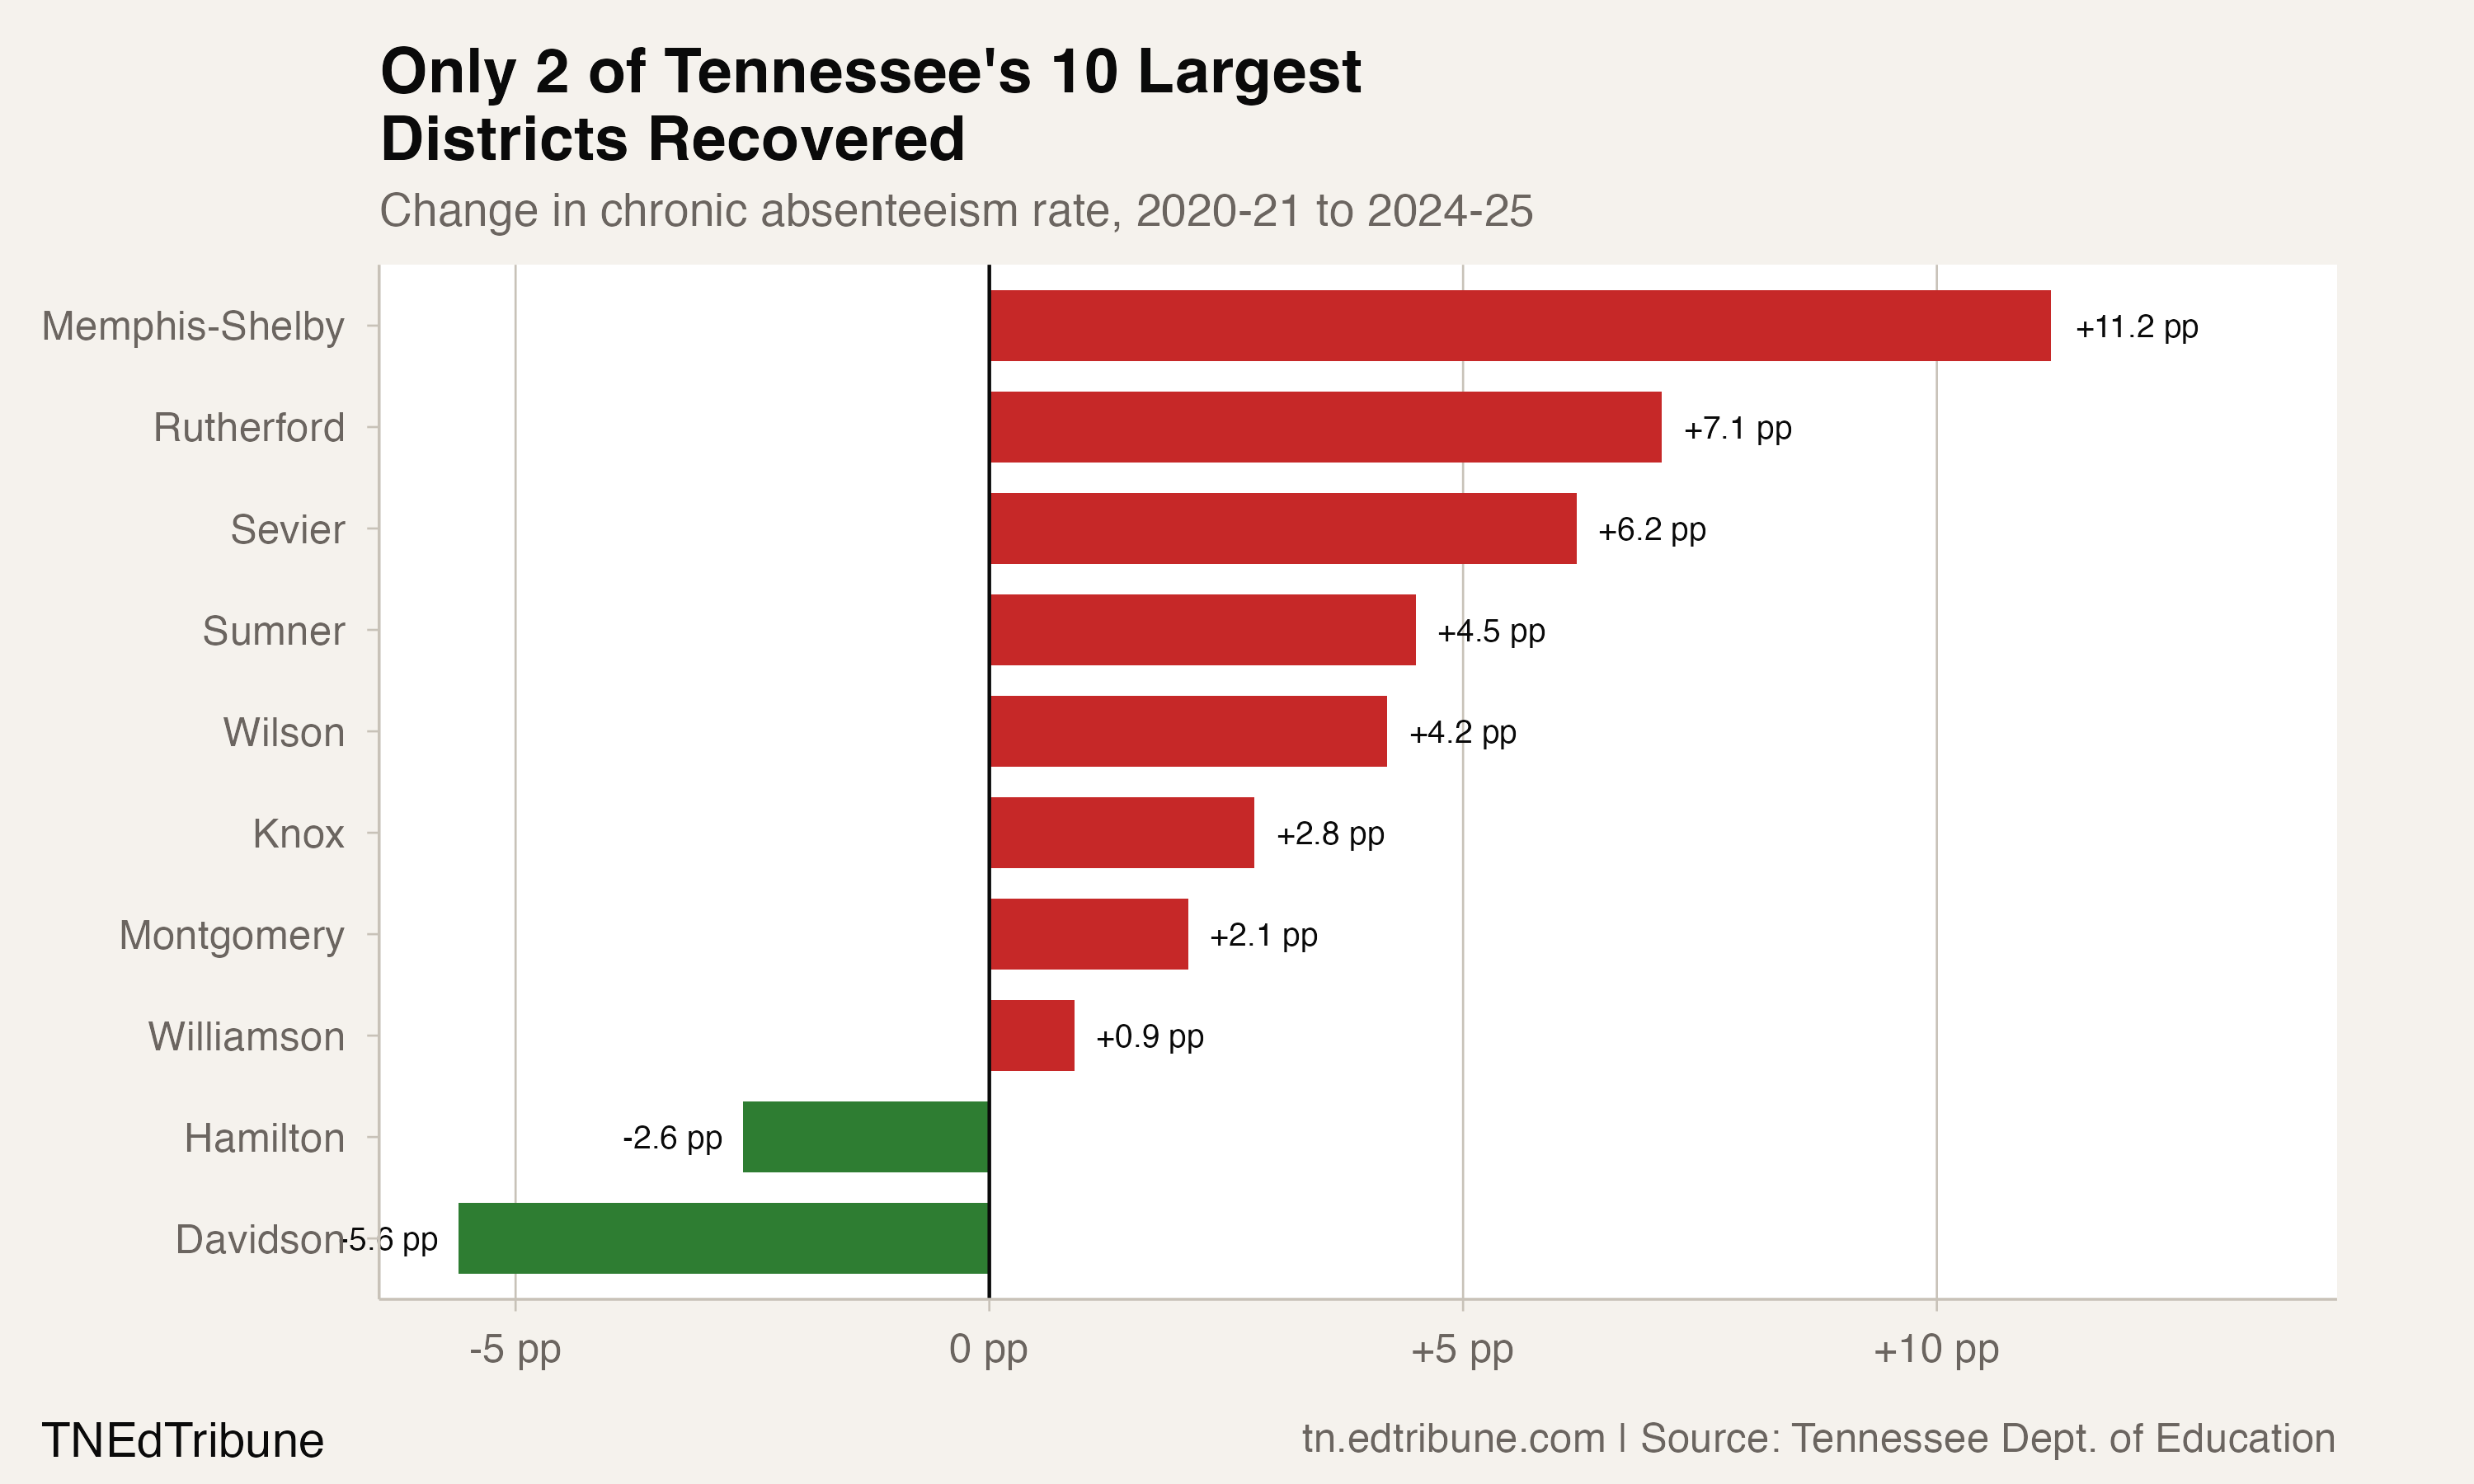
But filtering Memphis out does not change the math. Among the nine other largest districts, seven have not recovered either. Rutherford is up 7.1 points. Sevier County, the gateway to the Smoky Mountains tourist economy, is up 6.2. Sumner County outside Nashville is up 4.5. Wilson County is up 4.2. Knox County (Knoxville) spiked to 27.0% in 2021-22, then pulled back to 19.4%, still 2.8 points above its starting position.
Only two of Tennessee's 10 largest districts post lower chronic absenteeism rates now than in 2020-21: Davidson County (Nashville), which fell from 28.9% to 23.3%, and Hamilton County (Chattanooga), down from 19.7% to 17.1%.
The Nashville-Memphis divergence is stark enough to warrant its own chart. In 2020-21, Nashville's rate was 28.9% and Memphis's was 19.0%. Nashville was the worse-performing district by nearly 10 points. Four years later, their positions have inverted: Memphis sits at 30.2% while Nashville has pulled down to 23.3%, a gap of 6.9 points running in the opposite direction.
Memphis-Shelby County Schools↗ET has invested heavily -- 78 attendance liaisons, summer door-knocking campaigns, daily absence calls. The rate kept climbing. February 2026 midyear data showed nearly 40% of high schoolers still on track for chronic absenteeism in 2025-26.
Where the problem grew fastest
The districts with the worst deterioration are not concentrated in any single region or type. Humboldt City Schools in rural West Tennessee went from 6.3% to 24.8%, a jump of 18.5 percentage points. Lauderdale County, also in West Tennessee, rose from 8.5% to 22.3%, and is one of only three districts where chronic absenteeism has risen every year since 2021. Cocke County in the eastern mountains went from 12.4% to 26.2%. These are small districts, between 1,000 and 4,000 students, where a few hundred families changing habits reshapes the entire rate.
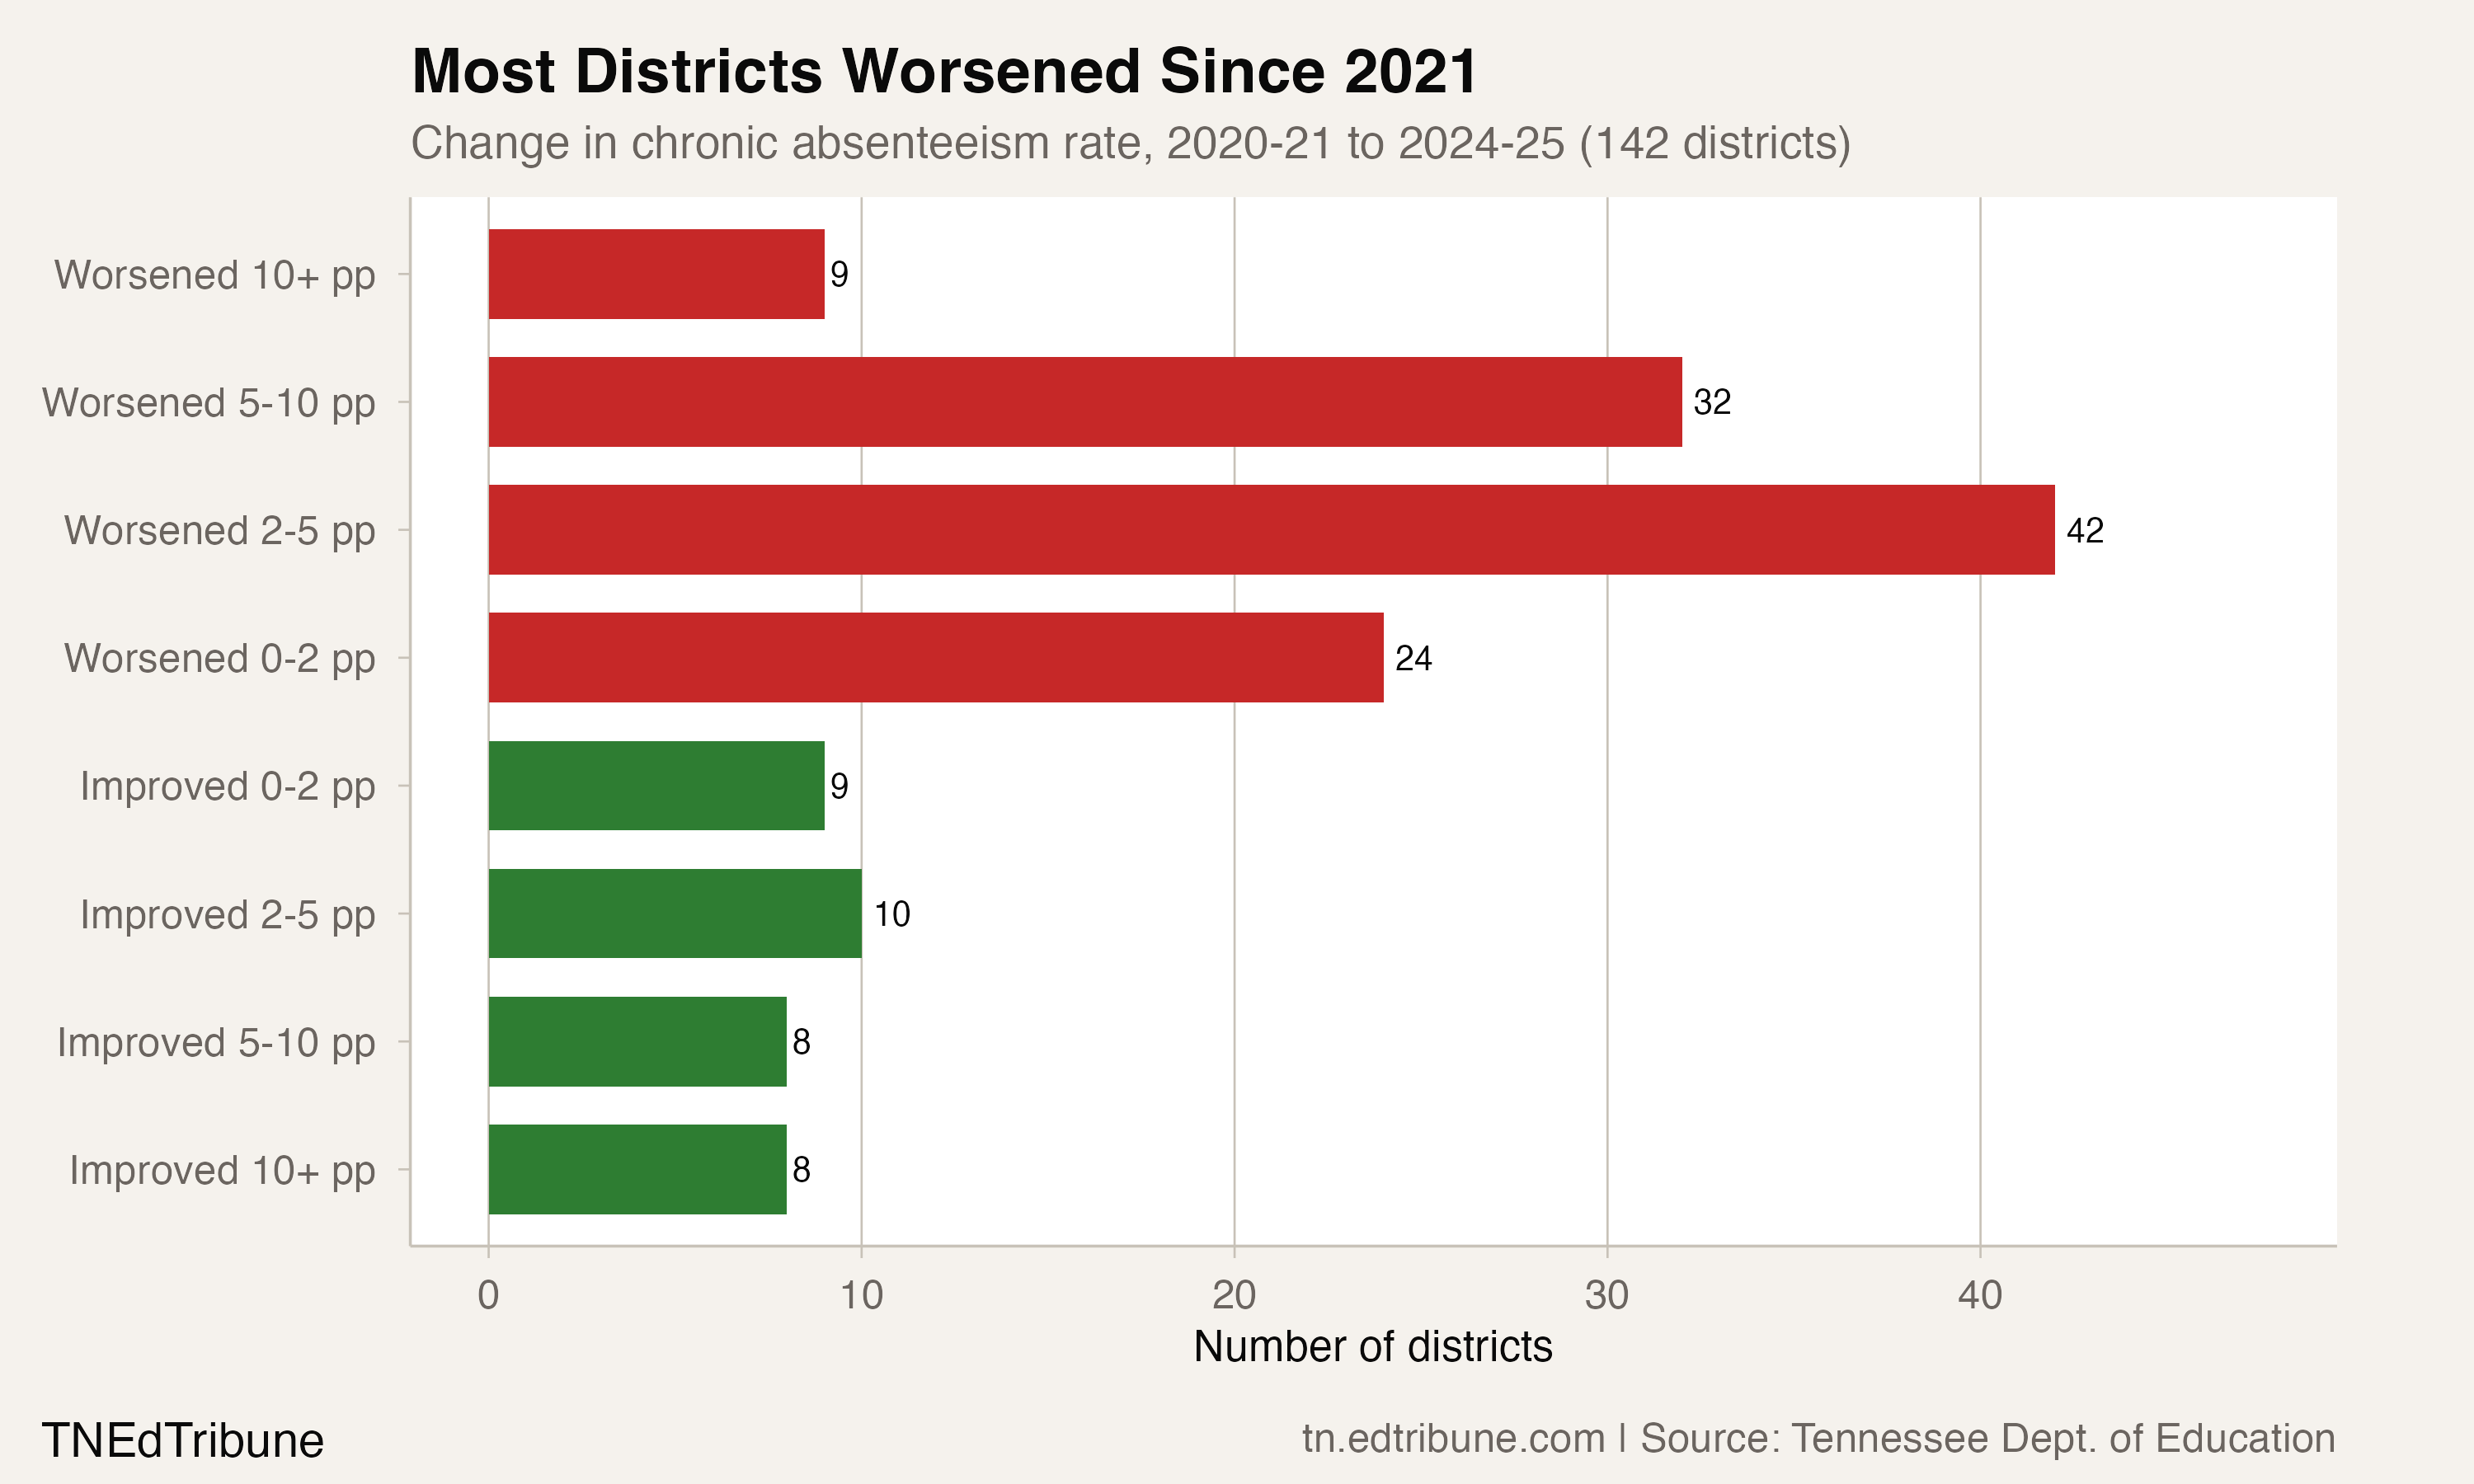
Forty-one districts, 28.9% of those tracked, worsened by more than five percentage points. Nine worsened by more than 10. The median district saw its rate rise 2.9 points. Even the "near-miss" category is thin: only 33 districts, 23.2%, are within two points in either direction of their 2021 rate.
The scatter of 2021 baseline versus 2025 rate shows the pattern visually. Most districts cluster above the diagonal line that marks no change, meaning their rates are higher now. The few green dots below the line are disproportionately districts that started with high rates in 2021: Robertson County (27.3% to 15.5%), Hickman County (32.7% to 17.4%), Monroe County (32.9% to 21.5%). Districts that started with low rates overwhelmingly got worse.
The suburban shift
One pattern cuts across the data: small and very small districts are the only size category where more than half have recovered. Among districts under 1,000 students, 52.2% are back to their 2021 levels. Among districts above 5,000 students, the recovery rate drops to roughly one in five.
This is partly mechanical. A small district's rate can swing several points when a few families re-engage with school. A large suburban system like Rutherford County, with 50,581 students, needs thousands of students to change behavior to move the needle. But the gap also reflects something structural. Suburban districts that reported very low chronic absenteeism before the pandemic, rates of 4% to 8%, appear to have experienced a permanent upward shift in what their communities consider normal absence patterns.
Rutherford's trajectory illustrates this. Its rate spiked from 4.2% to 9.5% in 2021-22, climbed further to 12.2% in 2022-23, and has since edged down only to 11.3%. The district more than doubled its "Annual Measurable Objective" target, beating the state's chronic absenteeism reduction goal. It is still nearly three times where it was four years ago.
Tennessee's funding formula adds a financial dimension. Under TISA, which replaced the BEP in 2023-24, base funding flows through Average Daily Membership. When students miss class, ADM falls and districts receive less money. For districts with chronic rates that tripled from their baselines, the attendance floor shifted under both student outcomes and operating budgets simultaneously.
What the recoveries look like
The 35 districts that have recovered share a common profile: most started with elevated rates in 2020-21 and had more room to improve. The strongest recovery belongs to Dayton City Schools, which dropped from 25.9% to 9.5%. Robertson County fell from 27.3% to 15.5%. These districts were not exemplars before the pandemic; they were among the worst performers in 2021, which gave them a lower bar to clear.
Nashville stands out because of its size. Davidson County enrolls 77,490 students and managed to cut its rate by 5.6 points, from 28.9% to 23.3%. The largest single-year improvement came in 2023-24, when the rate fell 3.7 points. Even so, Nashville's current 23.3% rate means nearly one in four students is chronically absent, and the 2020-21 figure it recovered to was itself a COVID-era rate. The Comptroller's office placed Tennessee's pre-COVID baseline at 13.1% for 2018-19. No major Tennessee district is close to that.
The enrollment-weighted picture
The district count, 35 of 142, actually understates the problem. Those 35 recovered districts collectively enroll 213,868 students, 25.3% of students in the 142-district comparison. The 107 non-recovered districts enroll 631,773 students, 74.7% of the same comparison group. Within that comparison group, roughly three out of four students attend a district where chronic absenteeism is worse now than it was during the first full pandemic school year.
The subgroup data at the state level reinforces this. White students, who had the lowest chronic absenteeism rate in 2020-21 at 12.0%, have seen the largest relative deterioration: up 3.5 points to 15.5%. Economically disadvantaged students rose from 25.8% to 29.9%, a 4.1-point increase. The one subgroup that improved is English learners, who fell from 18.8% to 16.3%, a 2.5-point decline that may reflect both improved identification practices and targeted family outreach.
The state's overall rate sits at 18.3%, down from the 20.3% peak in 2021-22 but still 2.8 points above the 2020-21 figure and 5.2 points above the pre-COVID baseline. Statewide, 180,343 students were chronically absent in 2024-25. At the district level, the question is no longer when the spike will reverse. In most communities, it already has settled into a new normal.
The next test comes in fall 2026, when districts report their first attendance data under a full three years of TISA's funding incentives. If the financial signal, reduced ADM translating directly to reduced state funding, does not accelerate recovery beyond the current pace of 2 to 3 points per year in the non-recovery share, the structural explanation gains weight: Tennessee may have a permanent 18% to 19% chronic absenteeism floor rather than a 13% one.
Detailed code that reproduces the analysis and figures in this article is available exclusively to EdTribune subscribers.
Discussion
Sign in to join the discussion.
Loading comments...