Knox County↗ET's overall chronic absenteeism rate is 19.4%, just above the state average. For its economically disadvantaged students, the rate is 37.8%. That 18.4 percentage-point gap is the widest of any large district in Tennessee. Nearly two in five low-income students in Knox County missed more than 18 days of school last year, while four in five of their classmates overall showed up regularly enough to avoid the threshold.
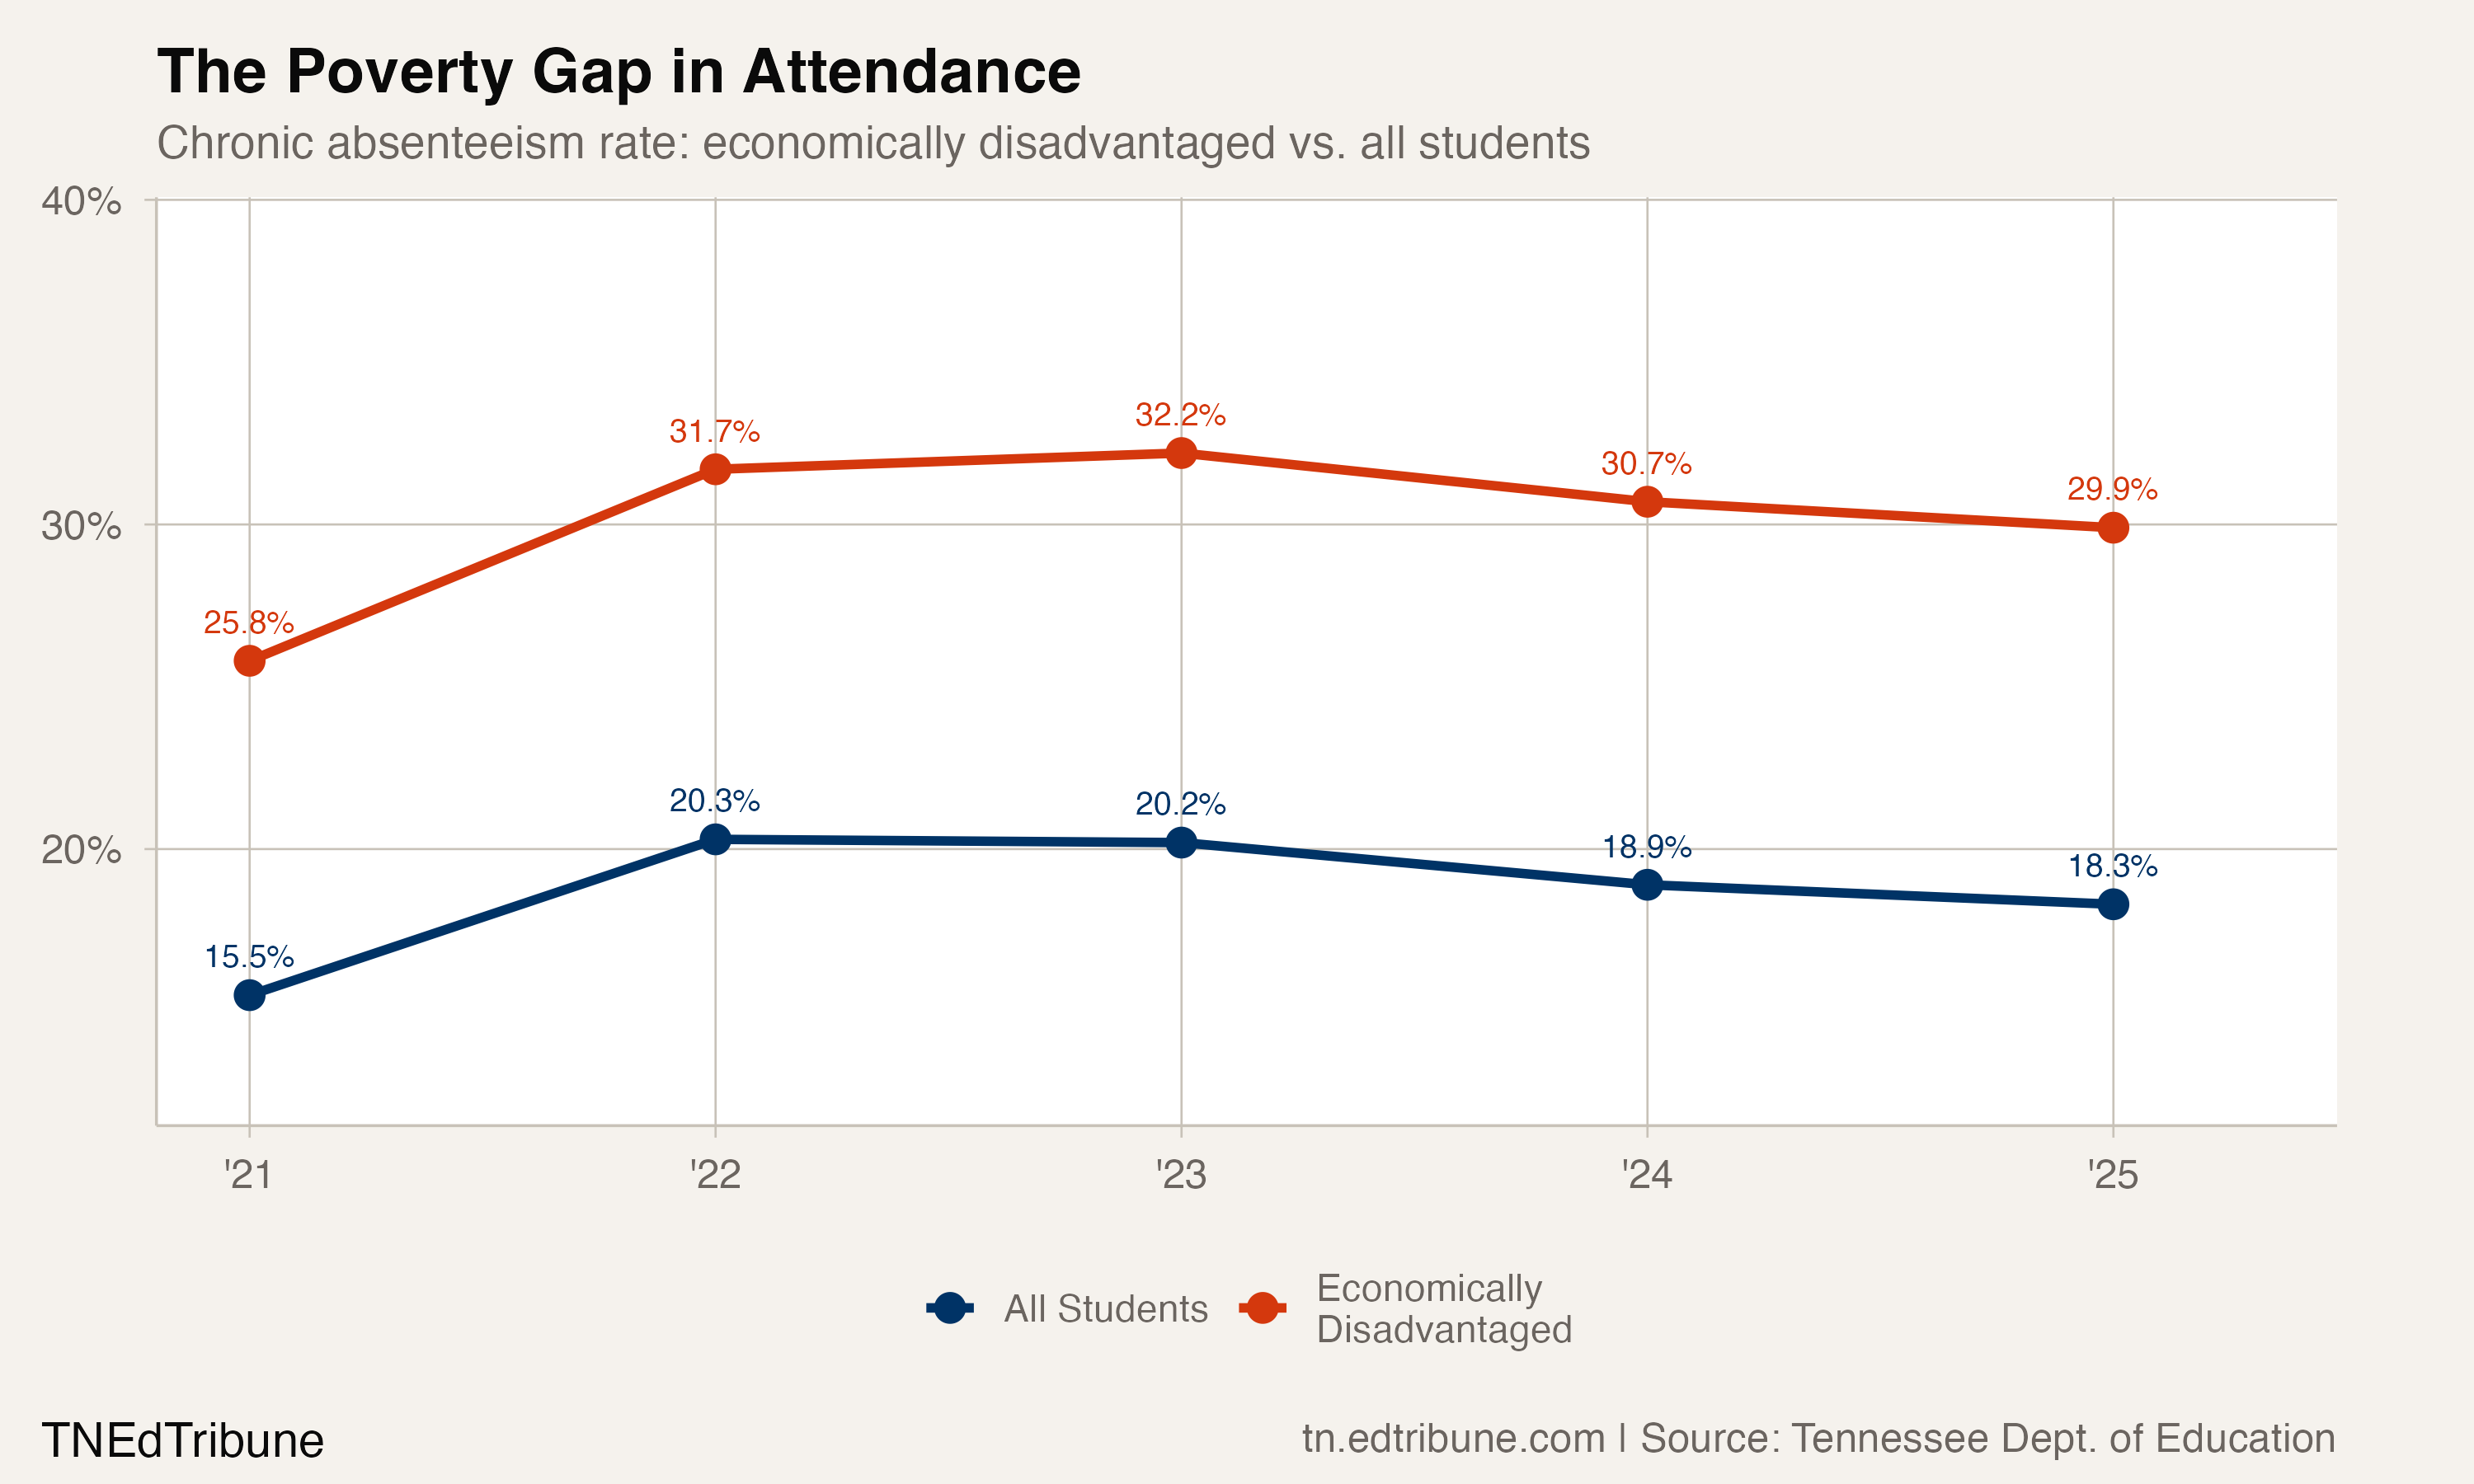
Knox County is not an outlier. Across Tennessee, 80,583 economically disadvantaged students were chronically absent in 2024-25, a rate of 29.9%. These students make up 27.3% of state enrollment but 44.7% of all chronically absent students, a disproportionality ratio of 1.64 to 1. The gap between their chronic rate and the statewide average has widened from 10.3 percentage points in 2020-21 to 11.6 points in 2024-25.
The definition matters as much as the data
A critical fact underlies these numbers: Tennessee almost certainly undercounts who qualifies as economically disadvantaged. In 2016, the state narrowed its definition from students eligible for free and reduced-price lunch to only those receiving SNAP or TANF benefits. The change immediately shrank the count of identified low-income students while Tennessee's actual child poverty rate, 19.7% in 2023, remained among the highest in the nation.
That means the 29.9% chronic absenteeism rate applies to a group that is itself a subset of the actual low-income student population. Students whose families earn too much for SNAP but still struggle with transportation, unstable housing, or untreated health conditions are counted in the "all students" average. The true poverty-related attendance gap is likely wider than what the data shows.
The Tennessee General Assembly is considering a fix. HB 2485/SB 2385, sponsored by Rep. Kirk Haston (R-Lobelville) and Sen. Joey Hensley (R-Hohenwald), would add Medicaid participants to the definition. The bill passed the House K-12 Subcommittee 6-2 and cleared the Senate Education Committee unanimously.
"The problem is we're missing a lot of kids who should qualify but don't actually participate in SNAP or TANF. Many of them, however, do participate in Medicaid." -- Rep. Kirk Haston, Nashville Banner, March 2026
If it passes, Metro Nashville Public Schools would see its economically disadvantaged share jump from 38% to 51% and its state funding increase from $49 million to $70 million. The bill's practical effect would be to make visible a population that already exists in the data but is not counted, shifting resources toward the districts where attendance barriers concentrate.
High school is where poverty hits hardest
Among economically disadvantaged students, the grade-level split is severe. In K-8, the chronic rate is 27.1%, elevated but on a downward trajectory from its 29.6% peak in 2022-23. High schools tell a different story: 38.0% in 2024-25, up from 37.5% the prior year. The recovery that brought K-8 down by 2.5 points over two years reversed in high schools, where the rate ticked back up by half a point.
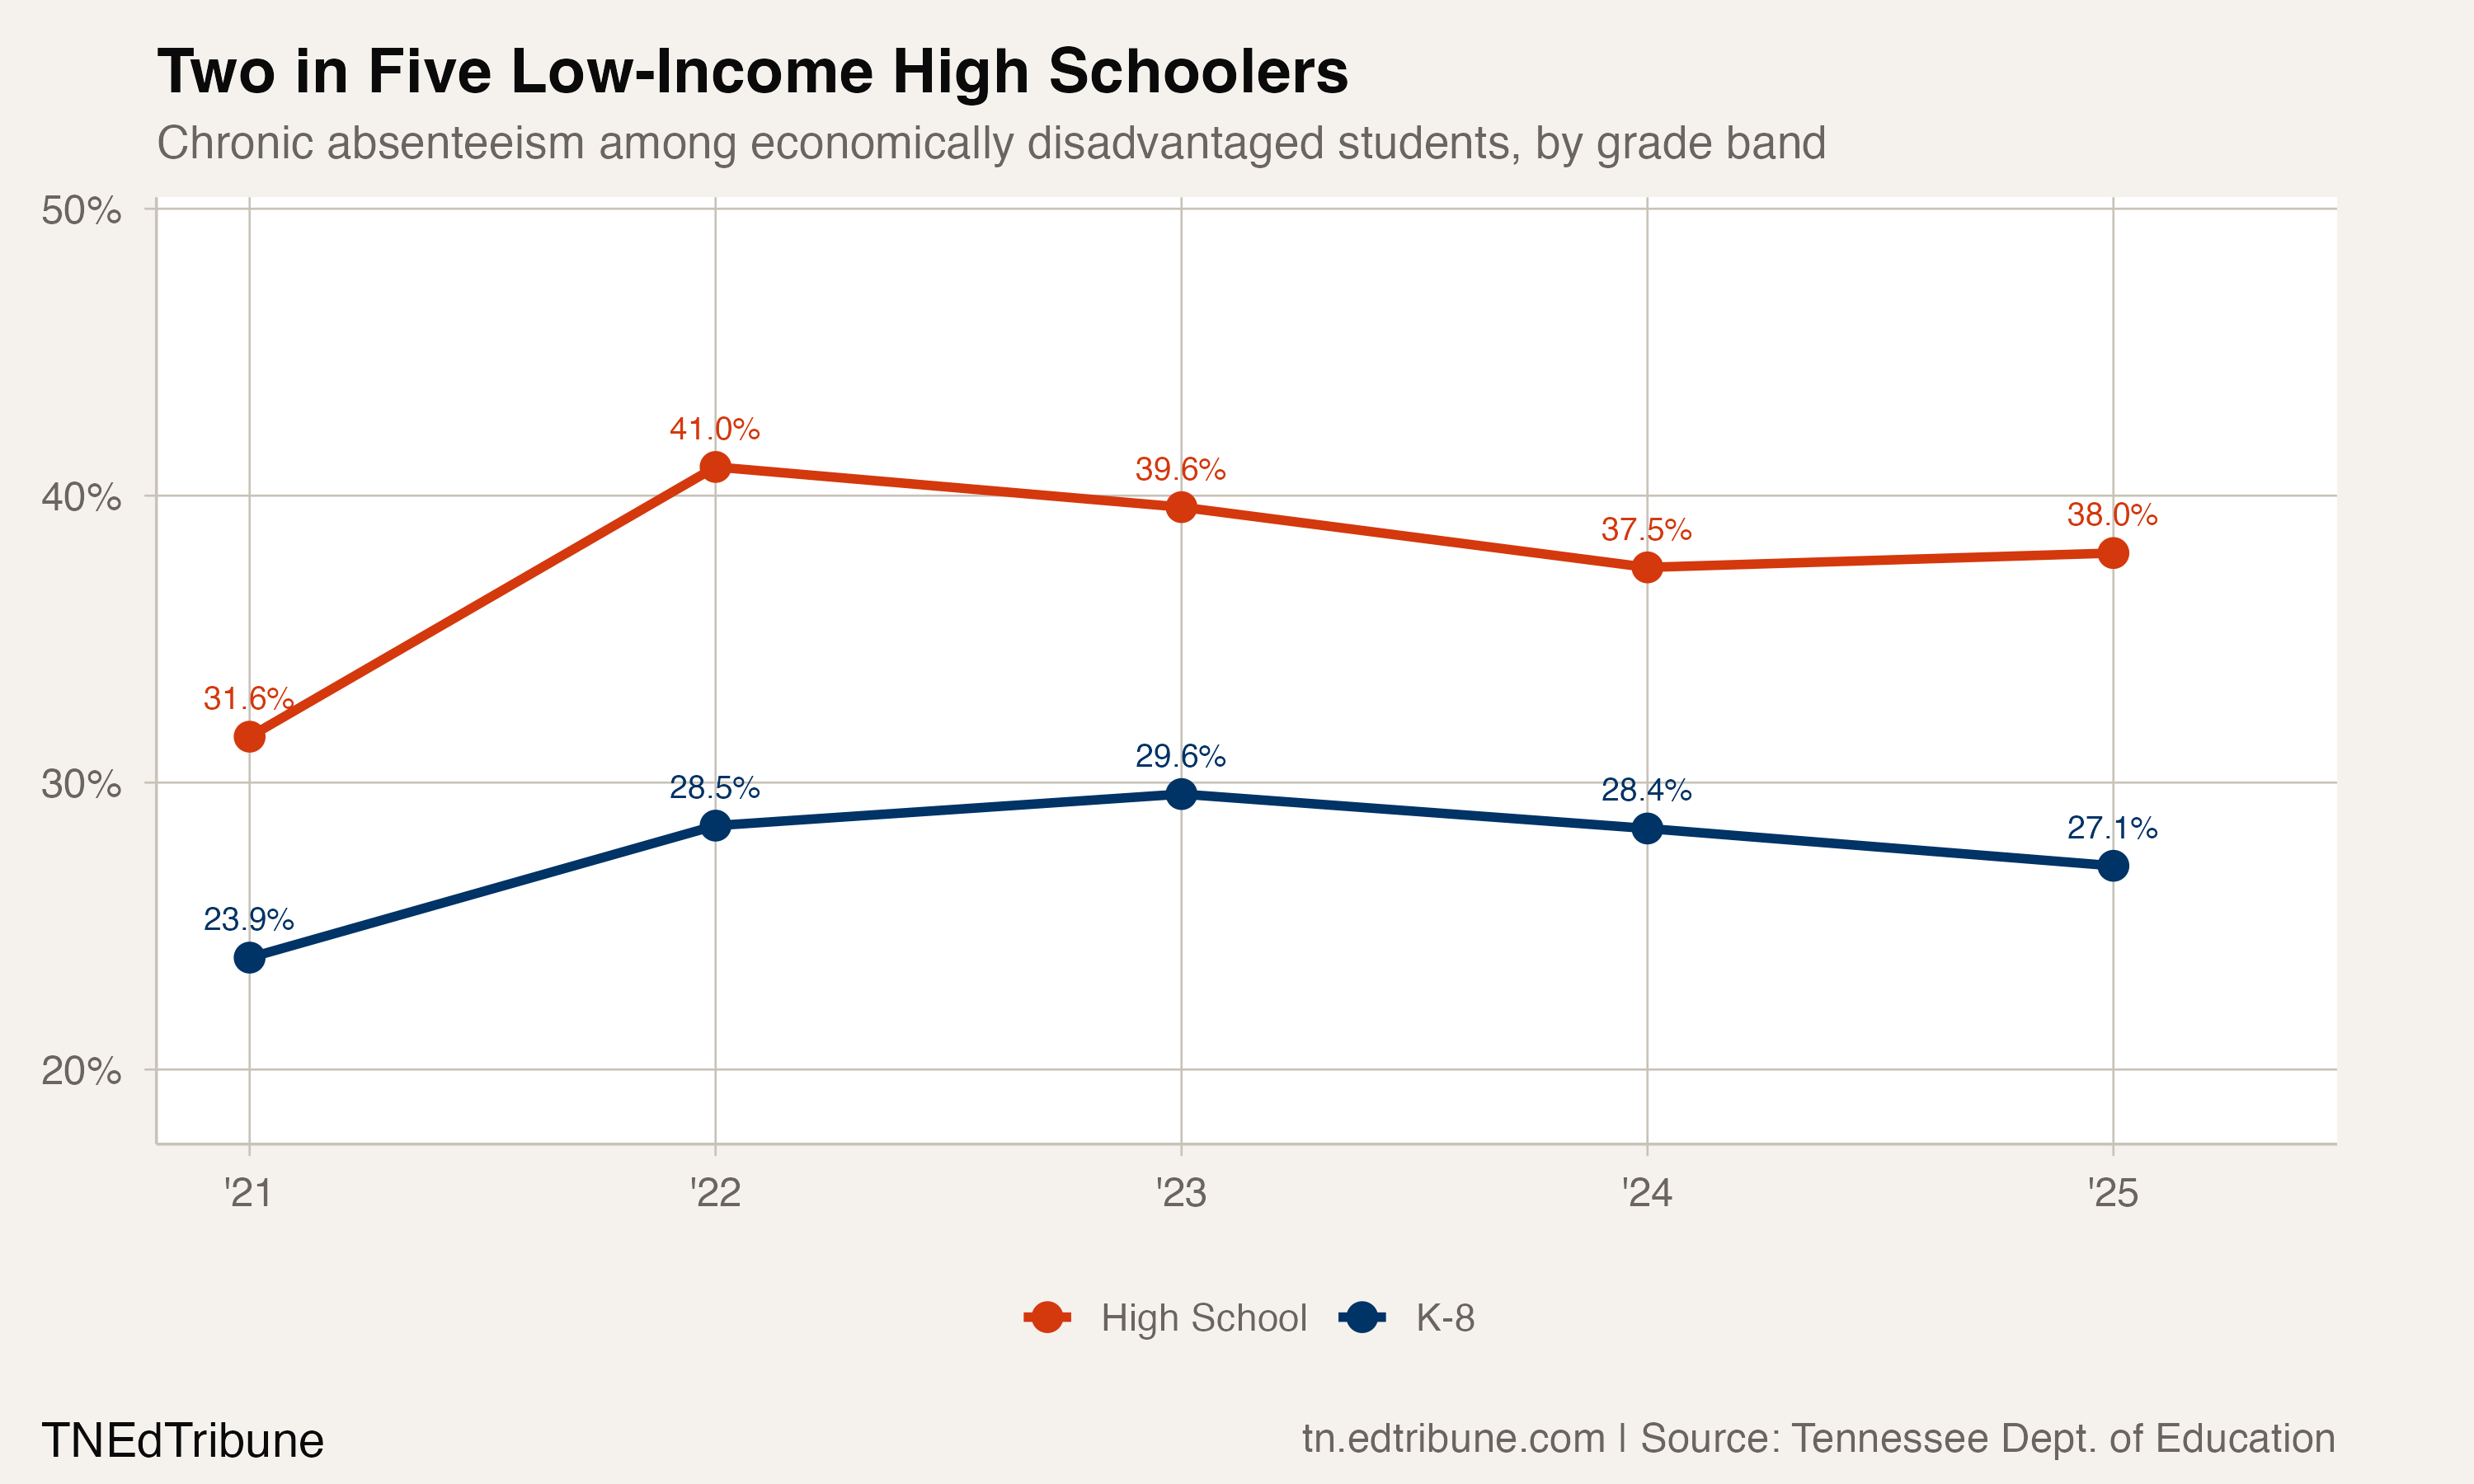
The 10.9 percentage-point gap between high school and K-8 for economically disadvantaged students is wider than the same gap for all students (7.7 points). Poverty does not just raise the overall rate. It amplifies the high school penalty, likely because older students face compounding barriers: part-time employment, caregiving responsibilities, transportation that was once a parent's problem becoming their own.
The Tennessee Comptroller's Office found that students who are chronically absent in ninth grade are 30 percentage points less likely to earn an on-time diploma, 62% versus 92%. For the 26,462 economically disadvantaged high schoolers who were chronically absent in 2024-25, that statistic is not abstract.
The slowest recovery of any group
Tennessee's overall chronic absenteeism rate has recovered 41.7% of its COVID-era spike, measured from the 2020-21 baseline. Economically disadvantaged students have recovered 35.9%, the lowest of any major subgroup. Hispanic students have fully returned to their pre-spike rate. White students have recovered 38.6%. Black students, 39.5%.
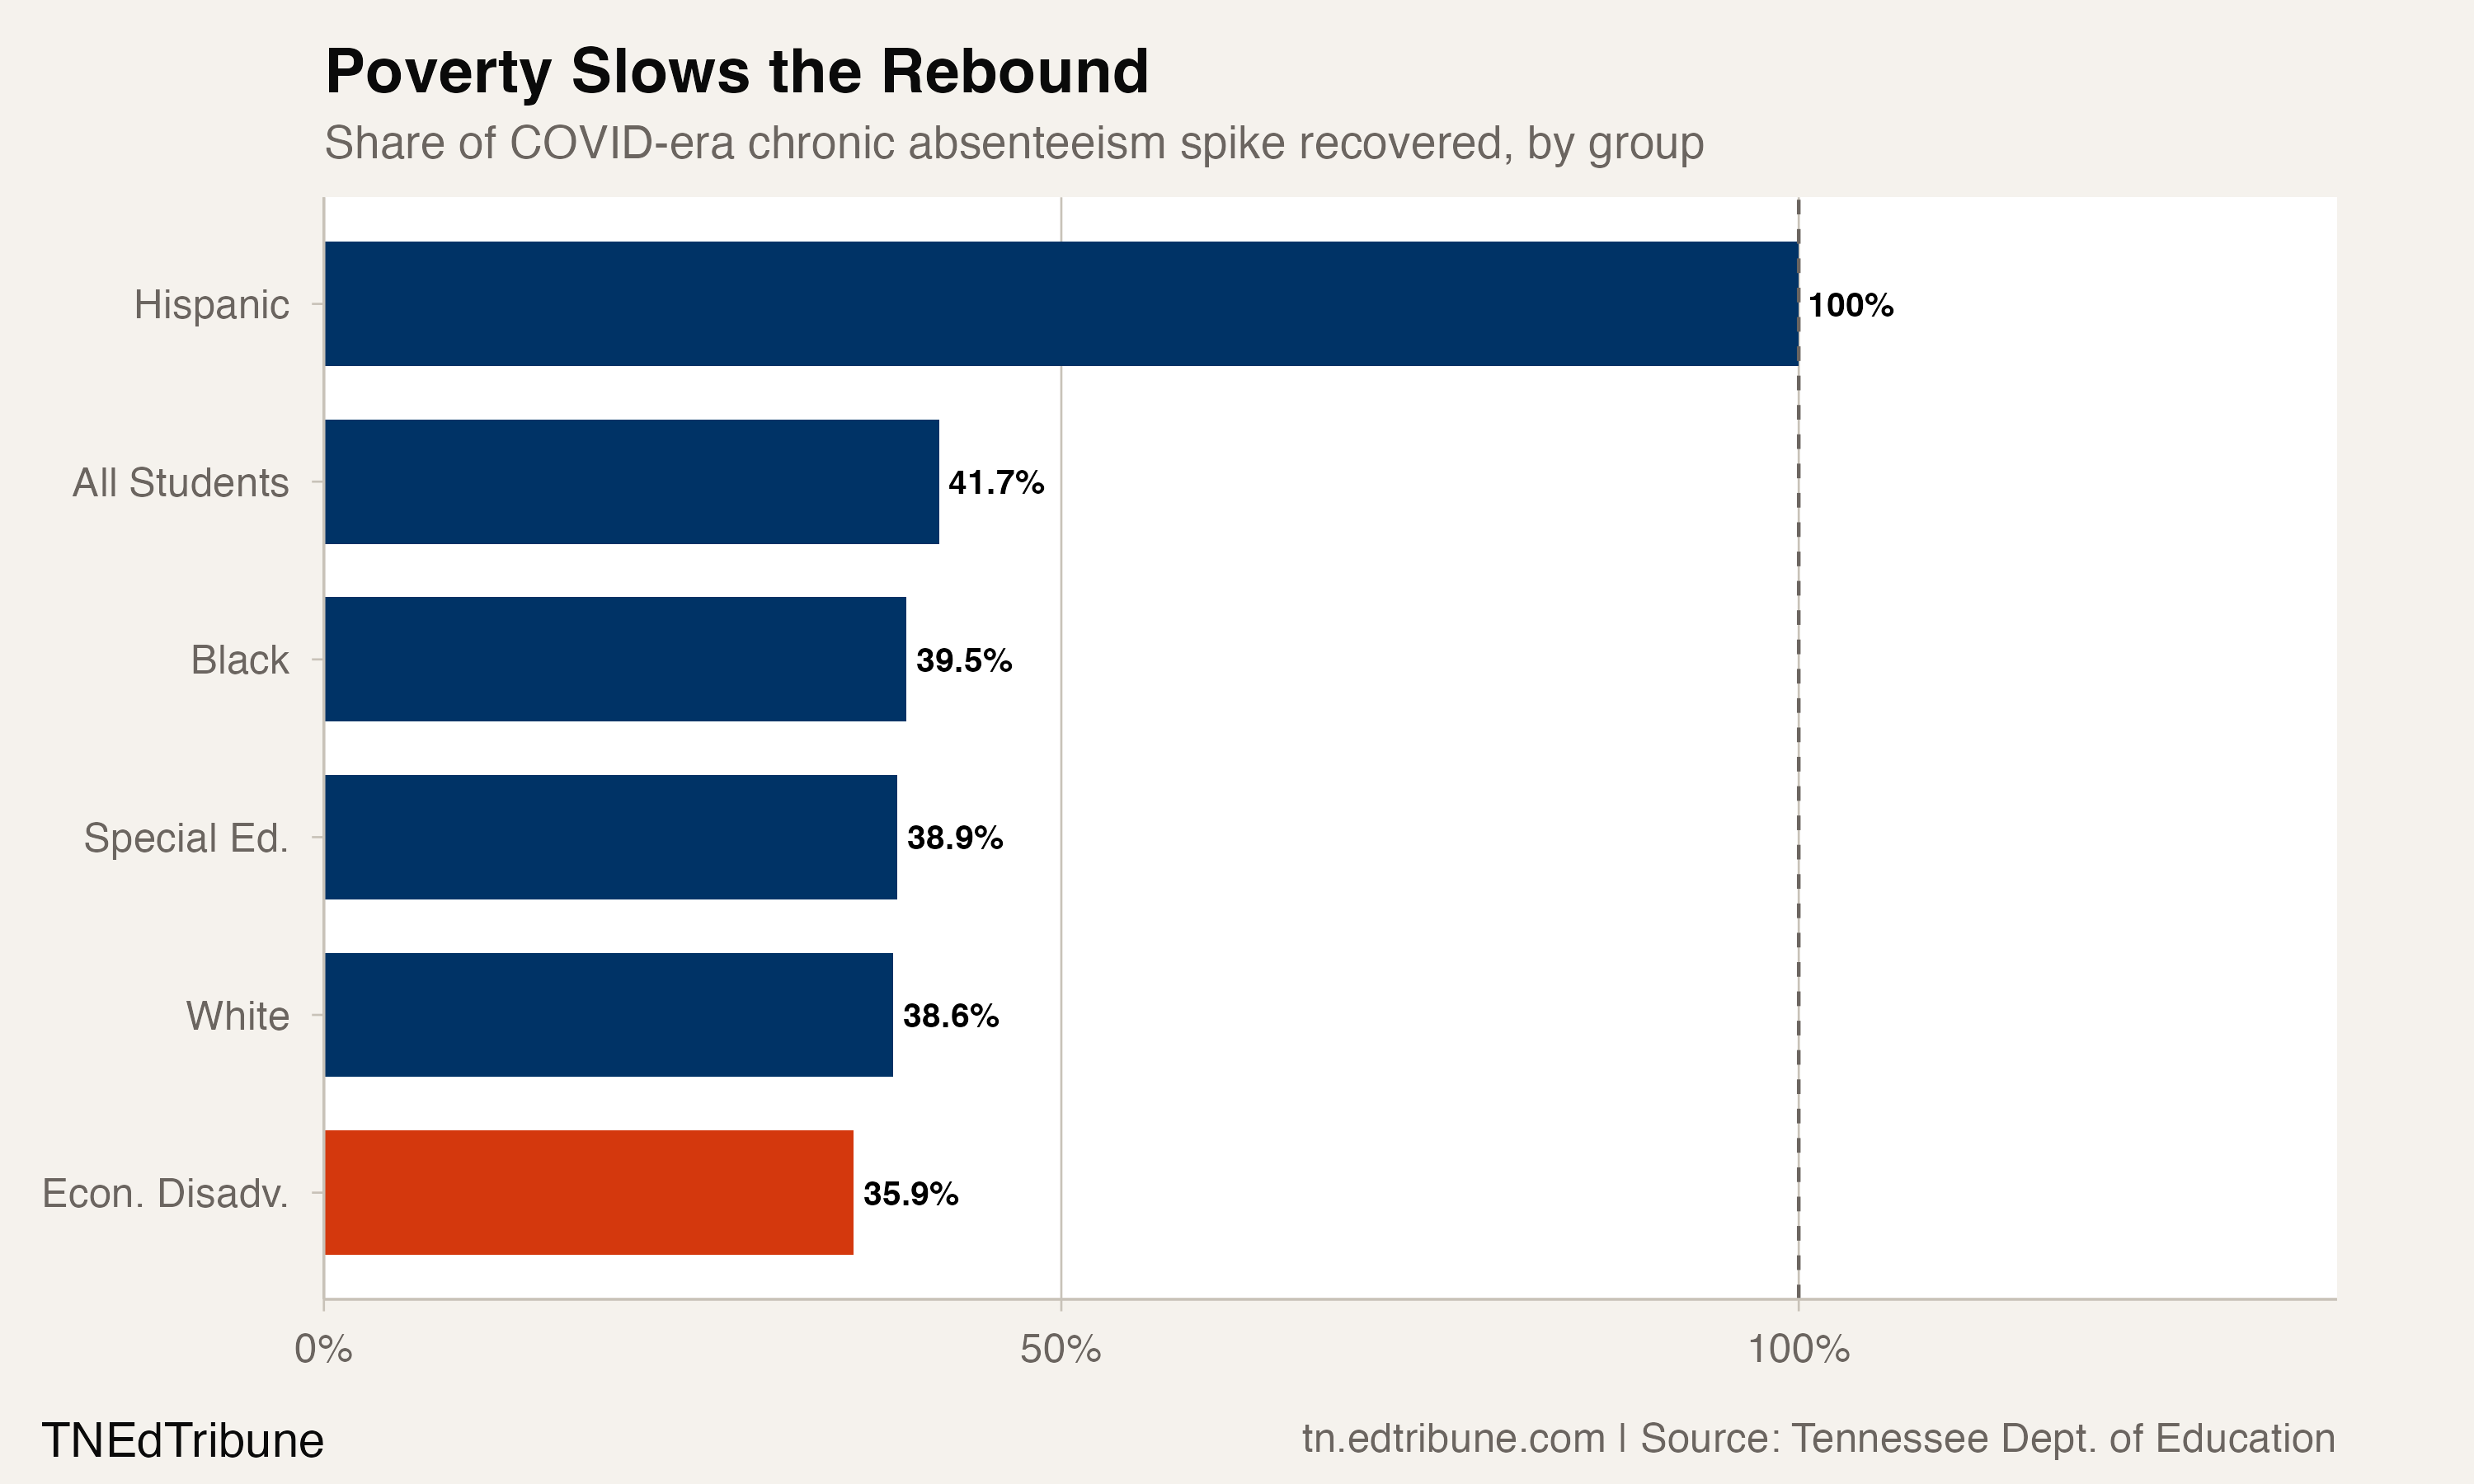
The pattern is consistent with what RAND researchers documented across more than half of urban districts nationally: the students who returned to regular attendance after 2022 were those with the fewest structural barriers. The families still absent tend to face interrelated problems, housing instability, unreliable transportation, unmet health needs, that do not respond to a phone call home or a truancy notice.
Tennessee's three-tier truancy intervention system escalates from universal prevention to juvenile court referral after seven unexcused absences. That framework was in place before the pandemic. Whether enforcement has tightened or loosened since then is not visible in this data, but the 64.1% of the poverty spike that remains unrecovered suggests the system's existing tools are insufficient for the hardest-to-reach families.
Where the gap is widest, and where it nearly disappears
The poverty penalty in attendance varies enormously by district. Among the 10 largest, Knox County's 18.4 percentage-point gap dwarfs Memphis-Shelby County's 5.8-point gap. That smaller Memphis gap does not reflect equity. It reflects a district where the overall rate is already so high, 30.2%, that there is less room between the average and the bottom.
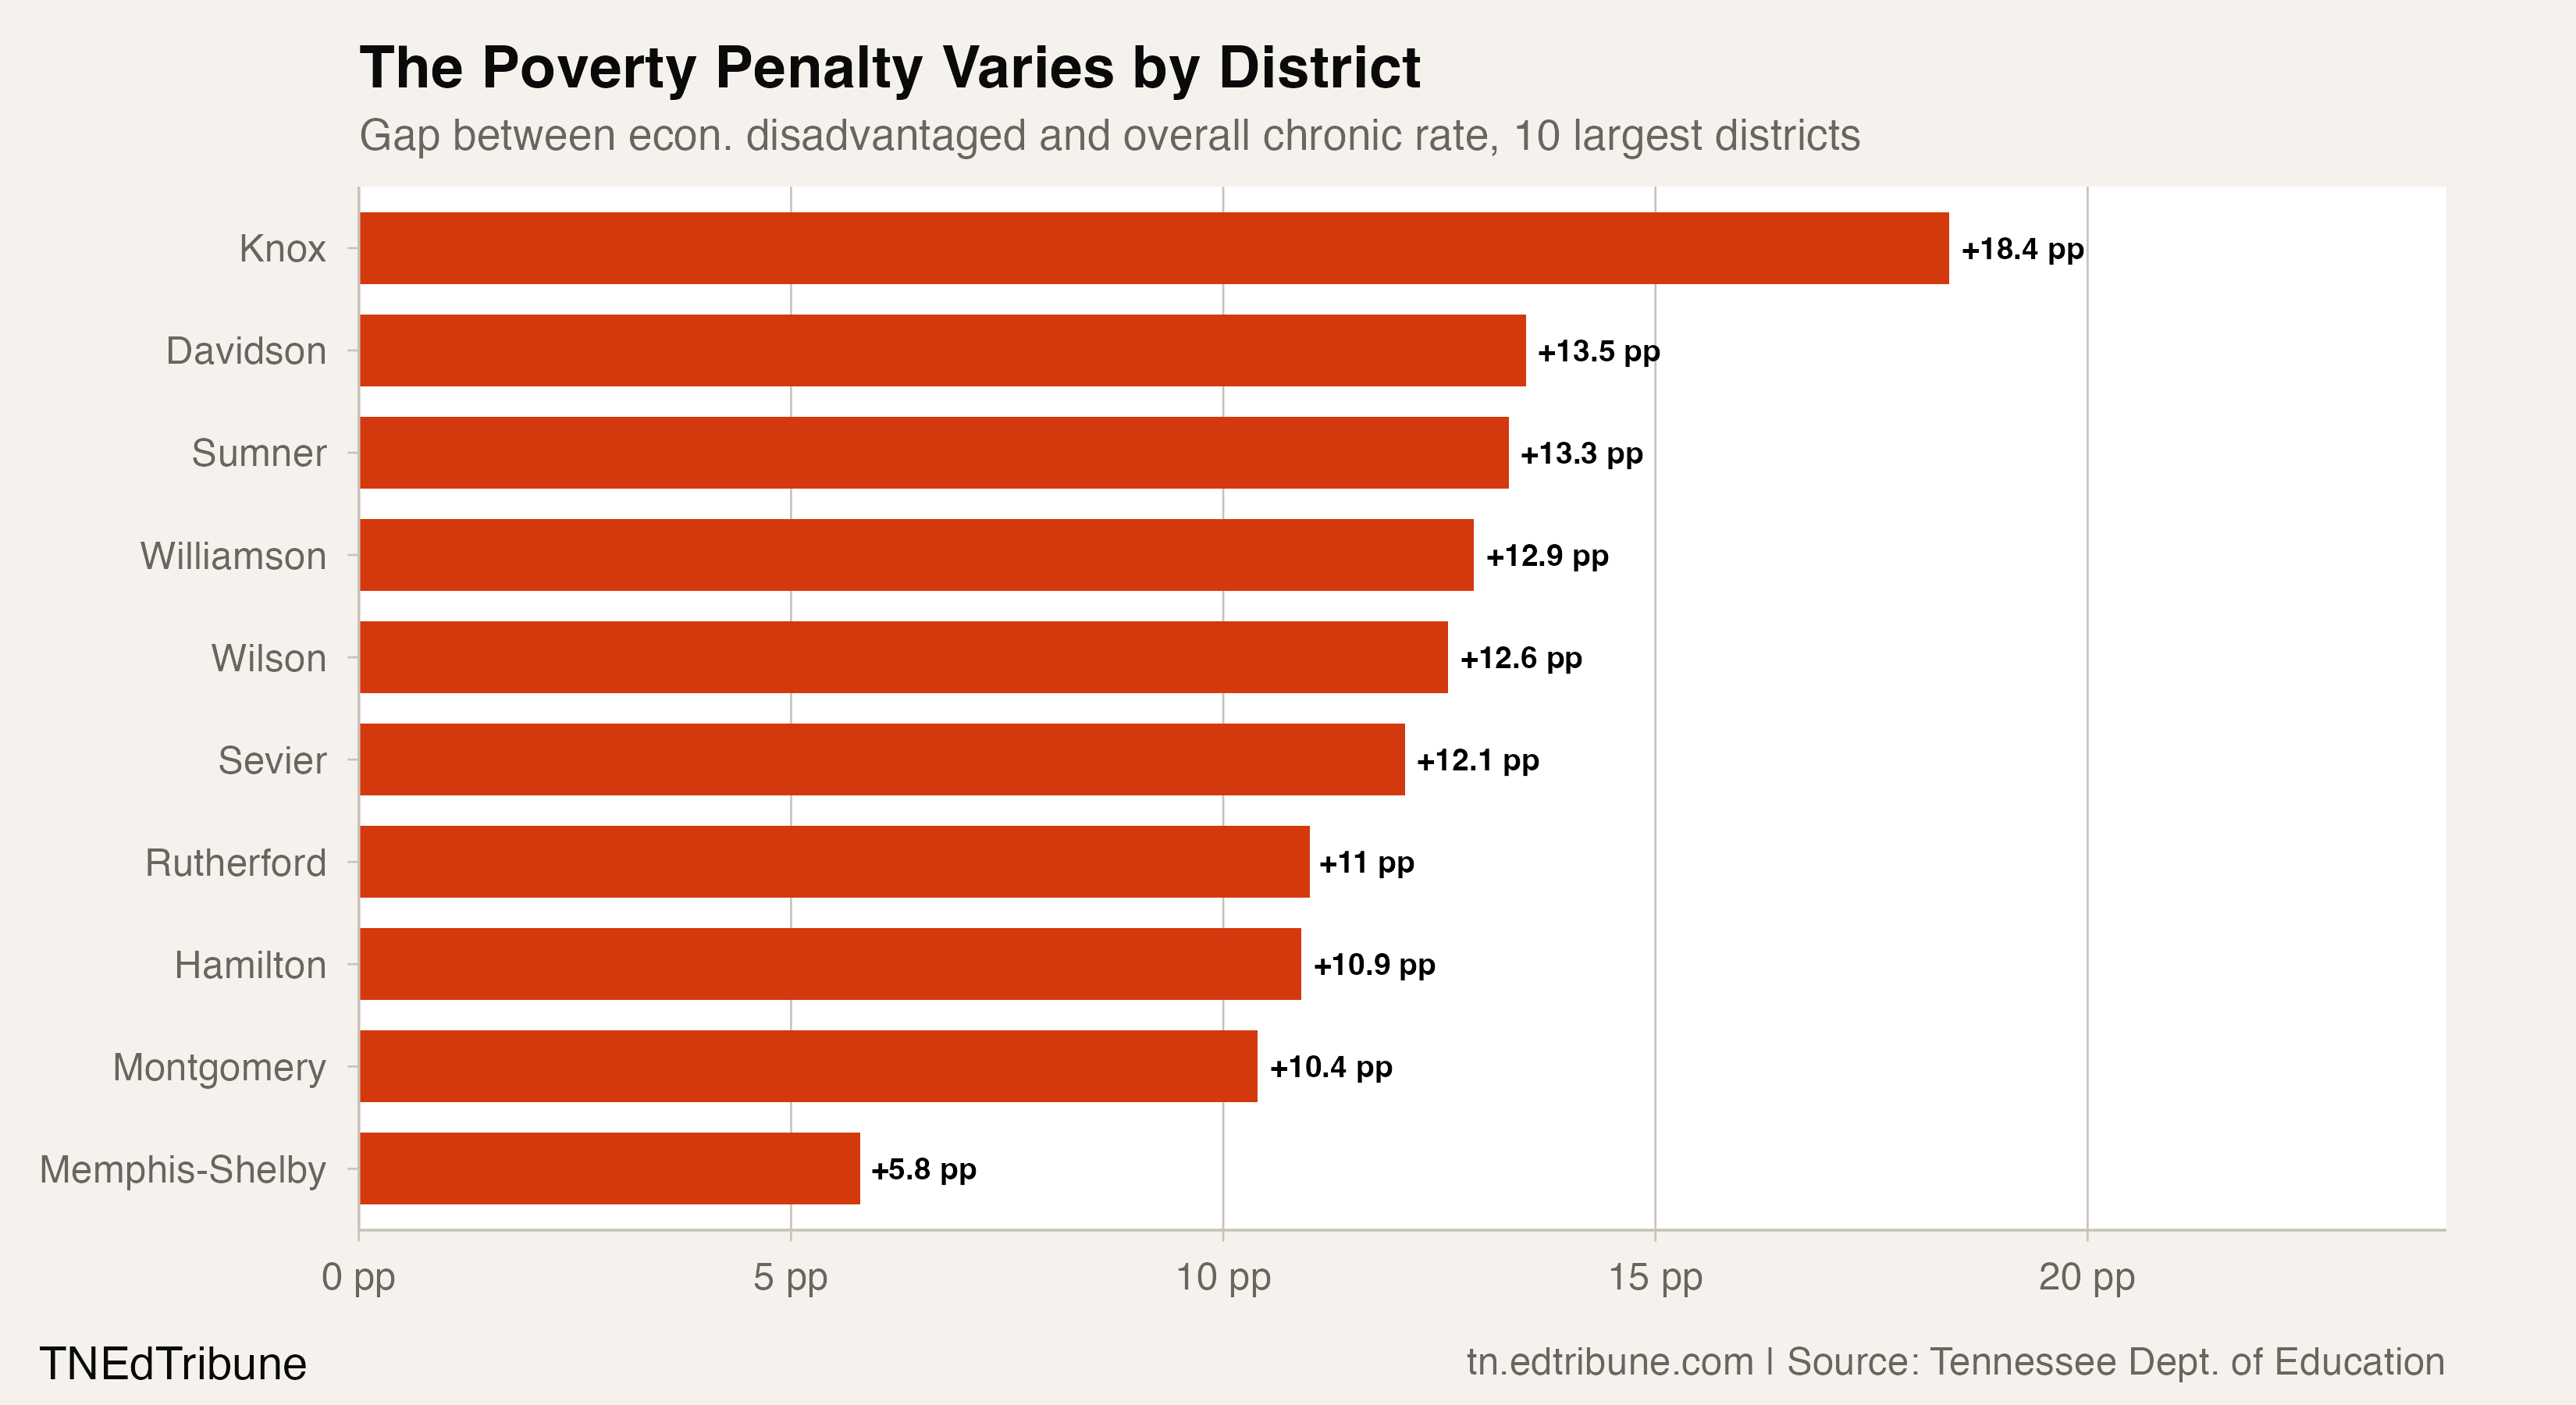
Nashville's gap is 13.5 points: 23.3% overall versus 36.8% for economically disadvantaged students. Four years ago, Nashville's economically disadvantaged rate was 42.1%. That it has fallen to 36.8% represents meaningful progress, a 5.3-point improvement, though the rate is still more than double the state average for all students.
At the other extreme, a handful of smaller districts have nearly eliminated the poverty gap. Milan's overall rate is 6.3% and its economically disadvantaged rate is 6.7%, a gap of 0.4 points. Morgan County: 6.9% overall, 8.4% economically disadvantaged, a 1.5-point gap. These are not large districts. Milan enrolls 616 economically disadvantaged students. But their existence proves the gap is not inevitable.
A funding formula that does not see the gap
Tennessee's TISA formula, which replaced the BEP in 2023-24, allocates weighted funding based partly on economically disadvantaged student counts. But as EdTrust-Tennessee documented in 2025, the state identifies a smaller share of students as economically disadvantaged than almost any other state despite having one of the nation's highest child poverty rates. The formula weights a population it systematically undercounts.
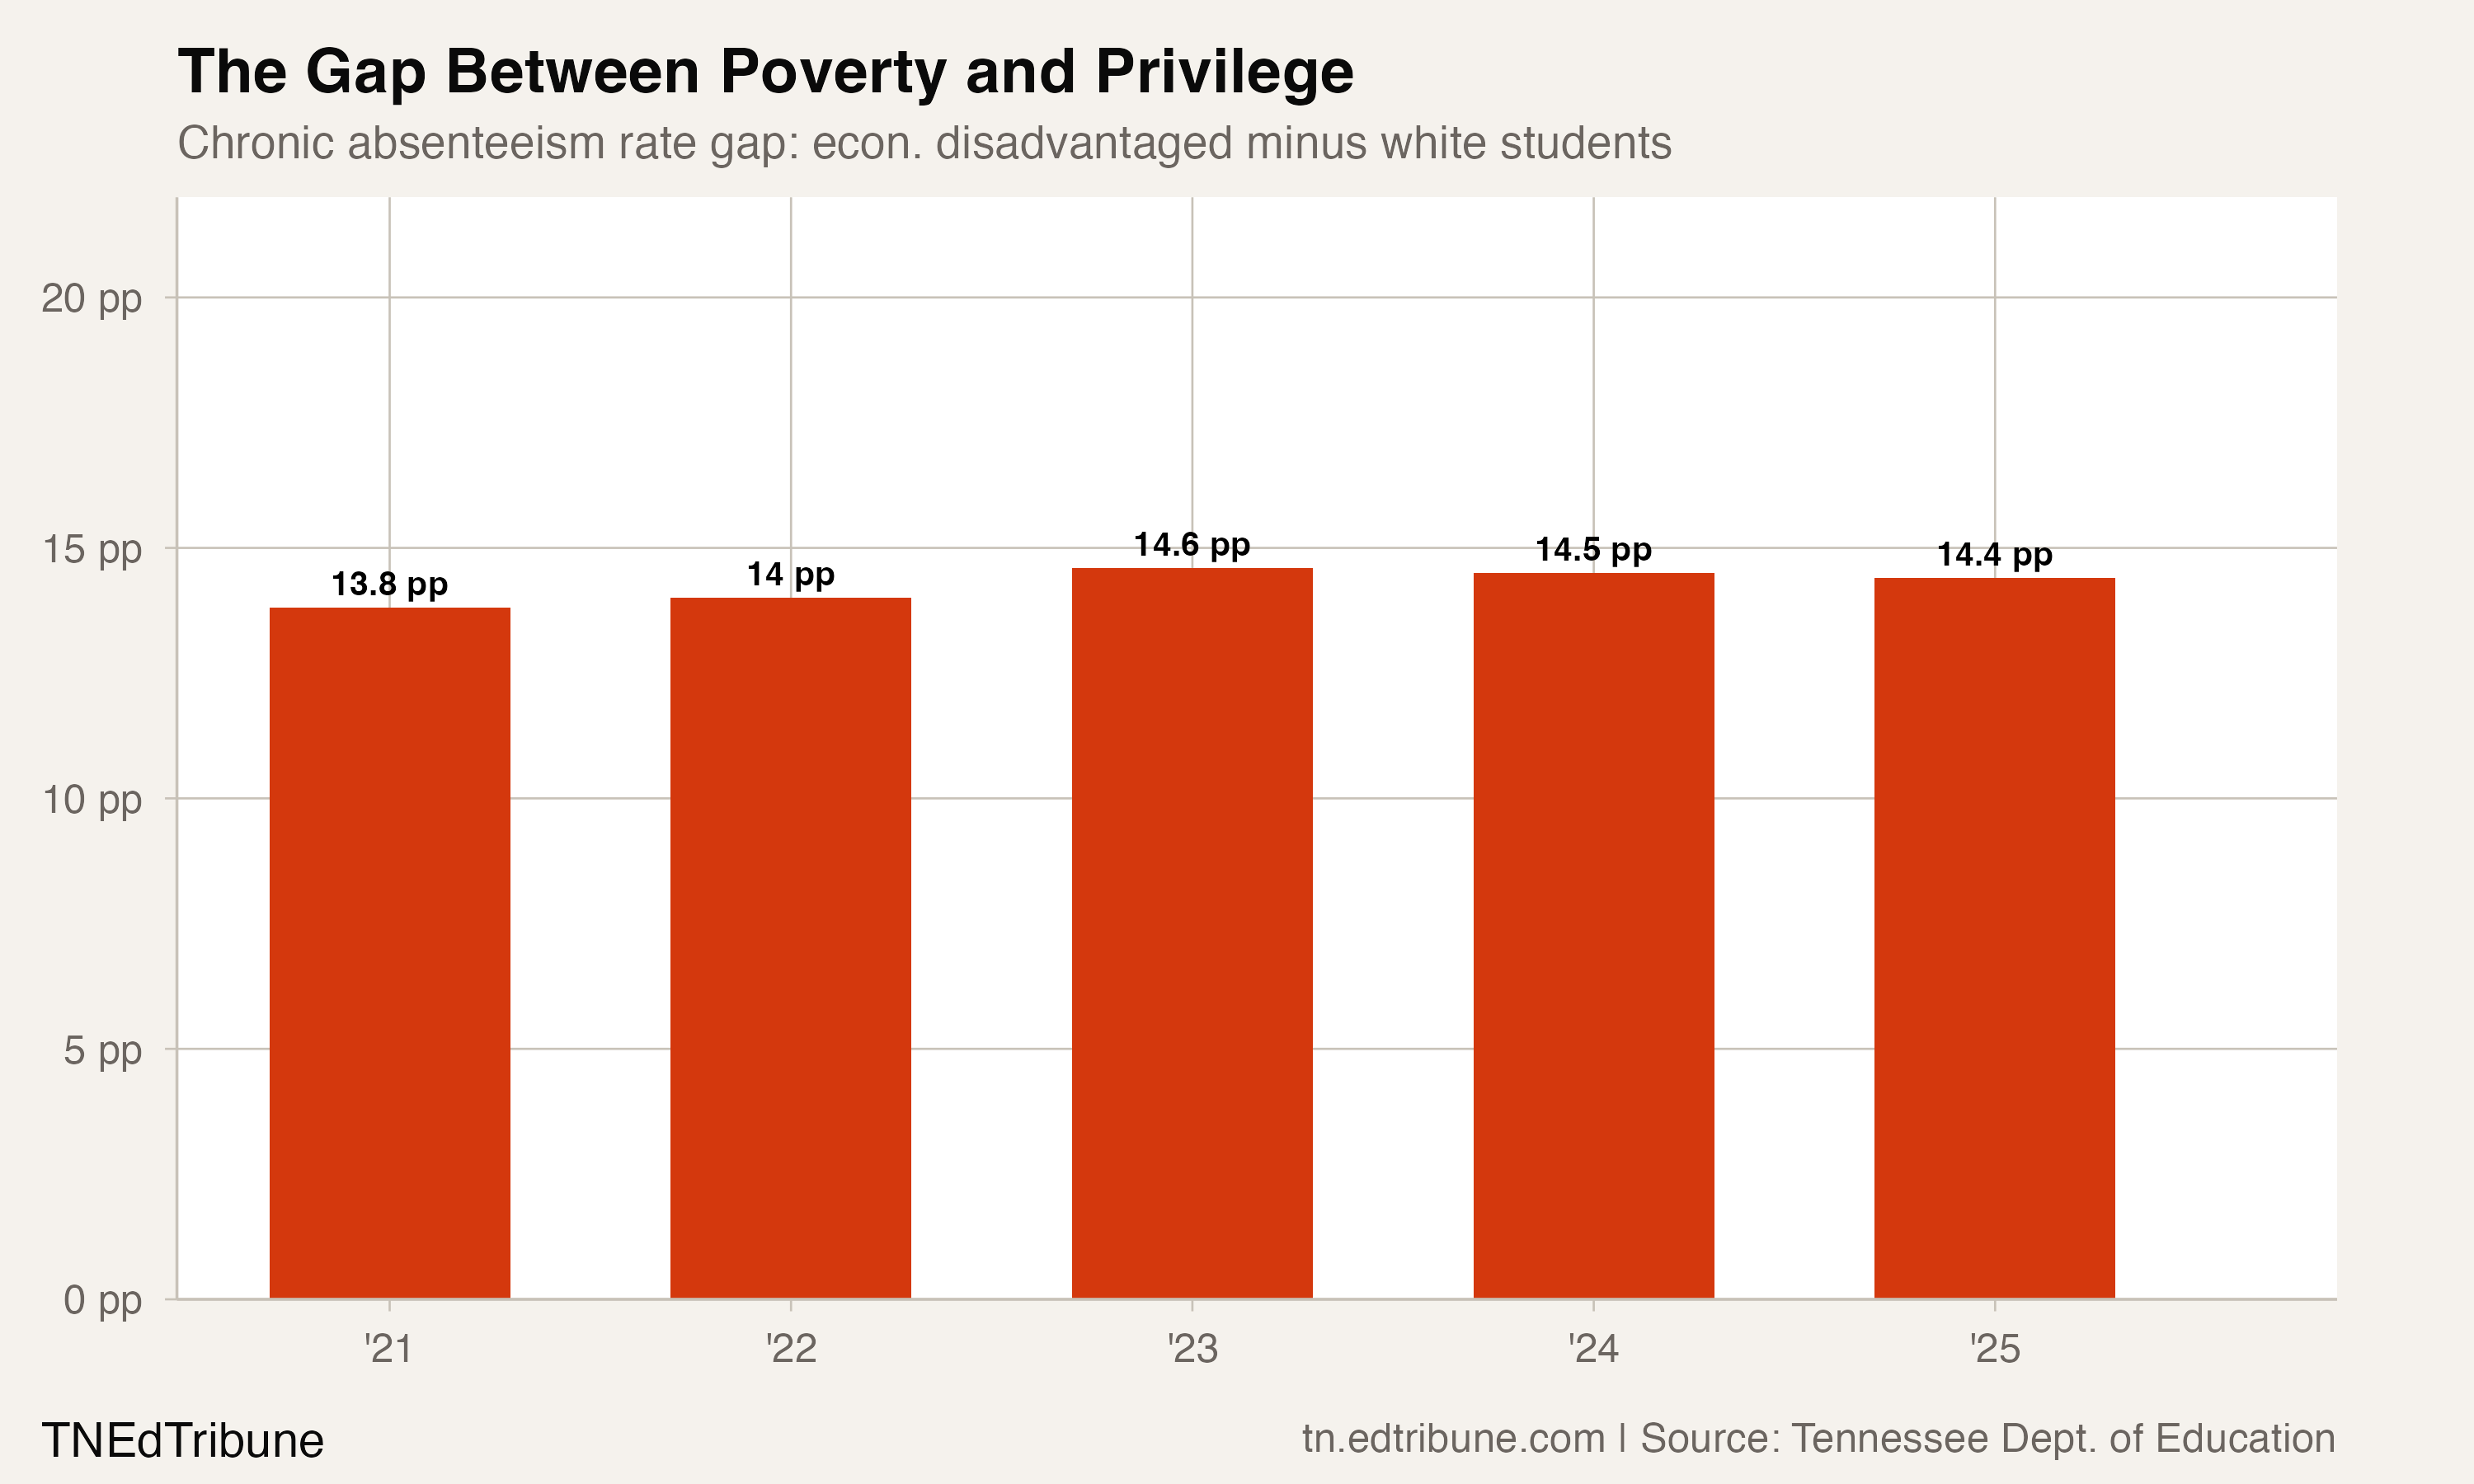
The gap between economically disadvantaged students and white students has remained locked between 13.8 and 14.6 percentage points across all five years of available data. The pandemic did not create this disparity; it widened both groups' rates roughly proportionally, then both partially recovered. The structural distance between them has not moved.
If HB 2485 passes and Medicaid participants enter the count, districts will receive more weighted funding, but the chronic absenteeism data will also shift. Newly identified students who were previously counted only in the "all students" category will become visible in the economically disadvantaged subgroup. The reported gap could widen before it narrows, as the data begins to reflect what was always true.
The 80,583 chronically absent economically disadvantaged students Tennessee counts today represent a floor, not a ceiling. The question for the 2025-26 school year is whether expanded identification, if the legislature acts, will bring resources to match the scale of the problem, or simply make a crisis that already existed harder to look away from.
Detailed code that reproduces the analysis and figures in this article is available exclusively to EdTribune subscribers.
Discussion
Sign in to join the discussion.
Loading comments...