The package's most recent published graduation data are for the 2024-25 school year, labeled 2025 in the dataset. They are historical results, not current 2026-27 outcomes.
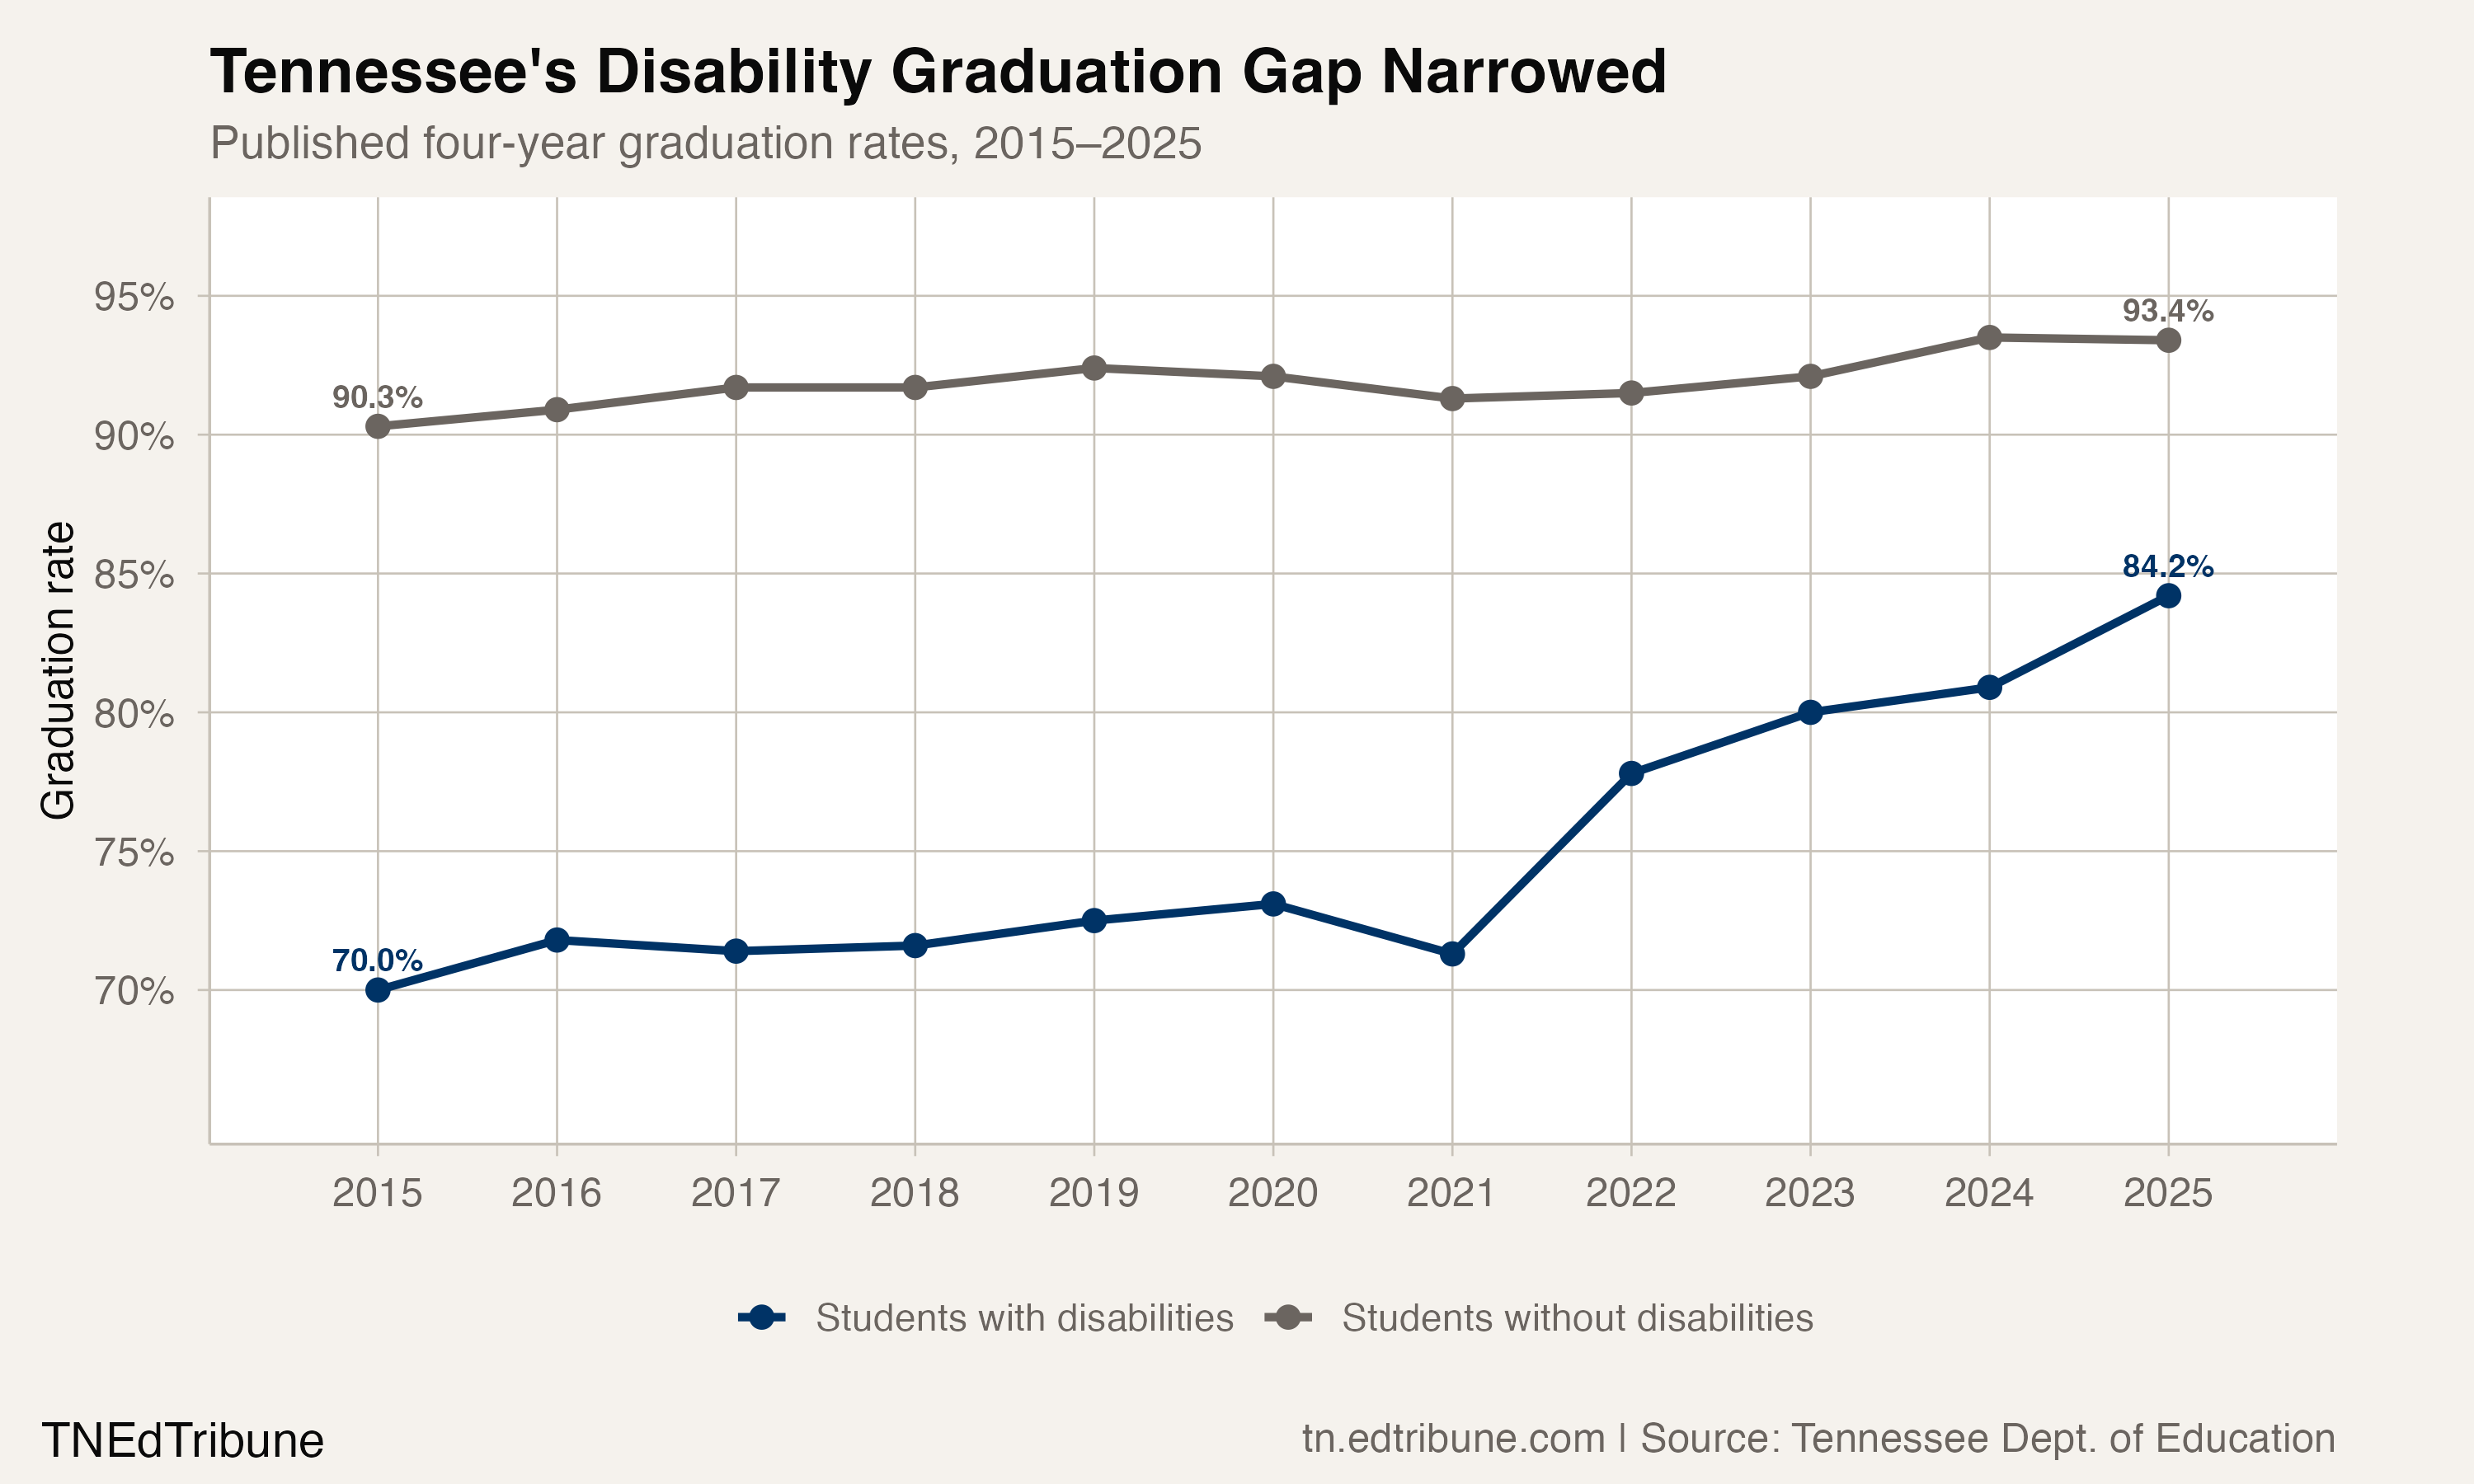
Tennessee's four-year graduation-rate gap between students with and without disabilities fell from 20.3 percentage points in 2015 to 9.2 points in 2025. The 11.1-point decline reduced the gap by 54.7%.
Over that period, the rate for students with disabilities rose from 70.0% to 84.2%, a 14.2-point gain. The rate for students without disabilities rose 3.1 points, from 90.3% to 93.4%.
The gap reached single digits
The annual gap was 20.3 points in 2015, 19.1 in 2016, 20.3 in 2017, 20.1 in 2018, 19.9 in 2019, 19.0 in 2020, 20.0 in 2021, 13.7 in 2022, 12.1 in 2023, 12.6 in 2024, and 9.2 in 2025.
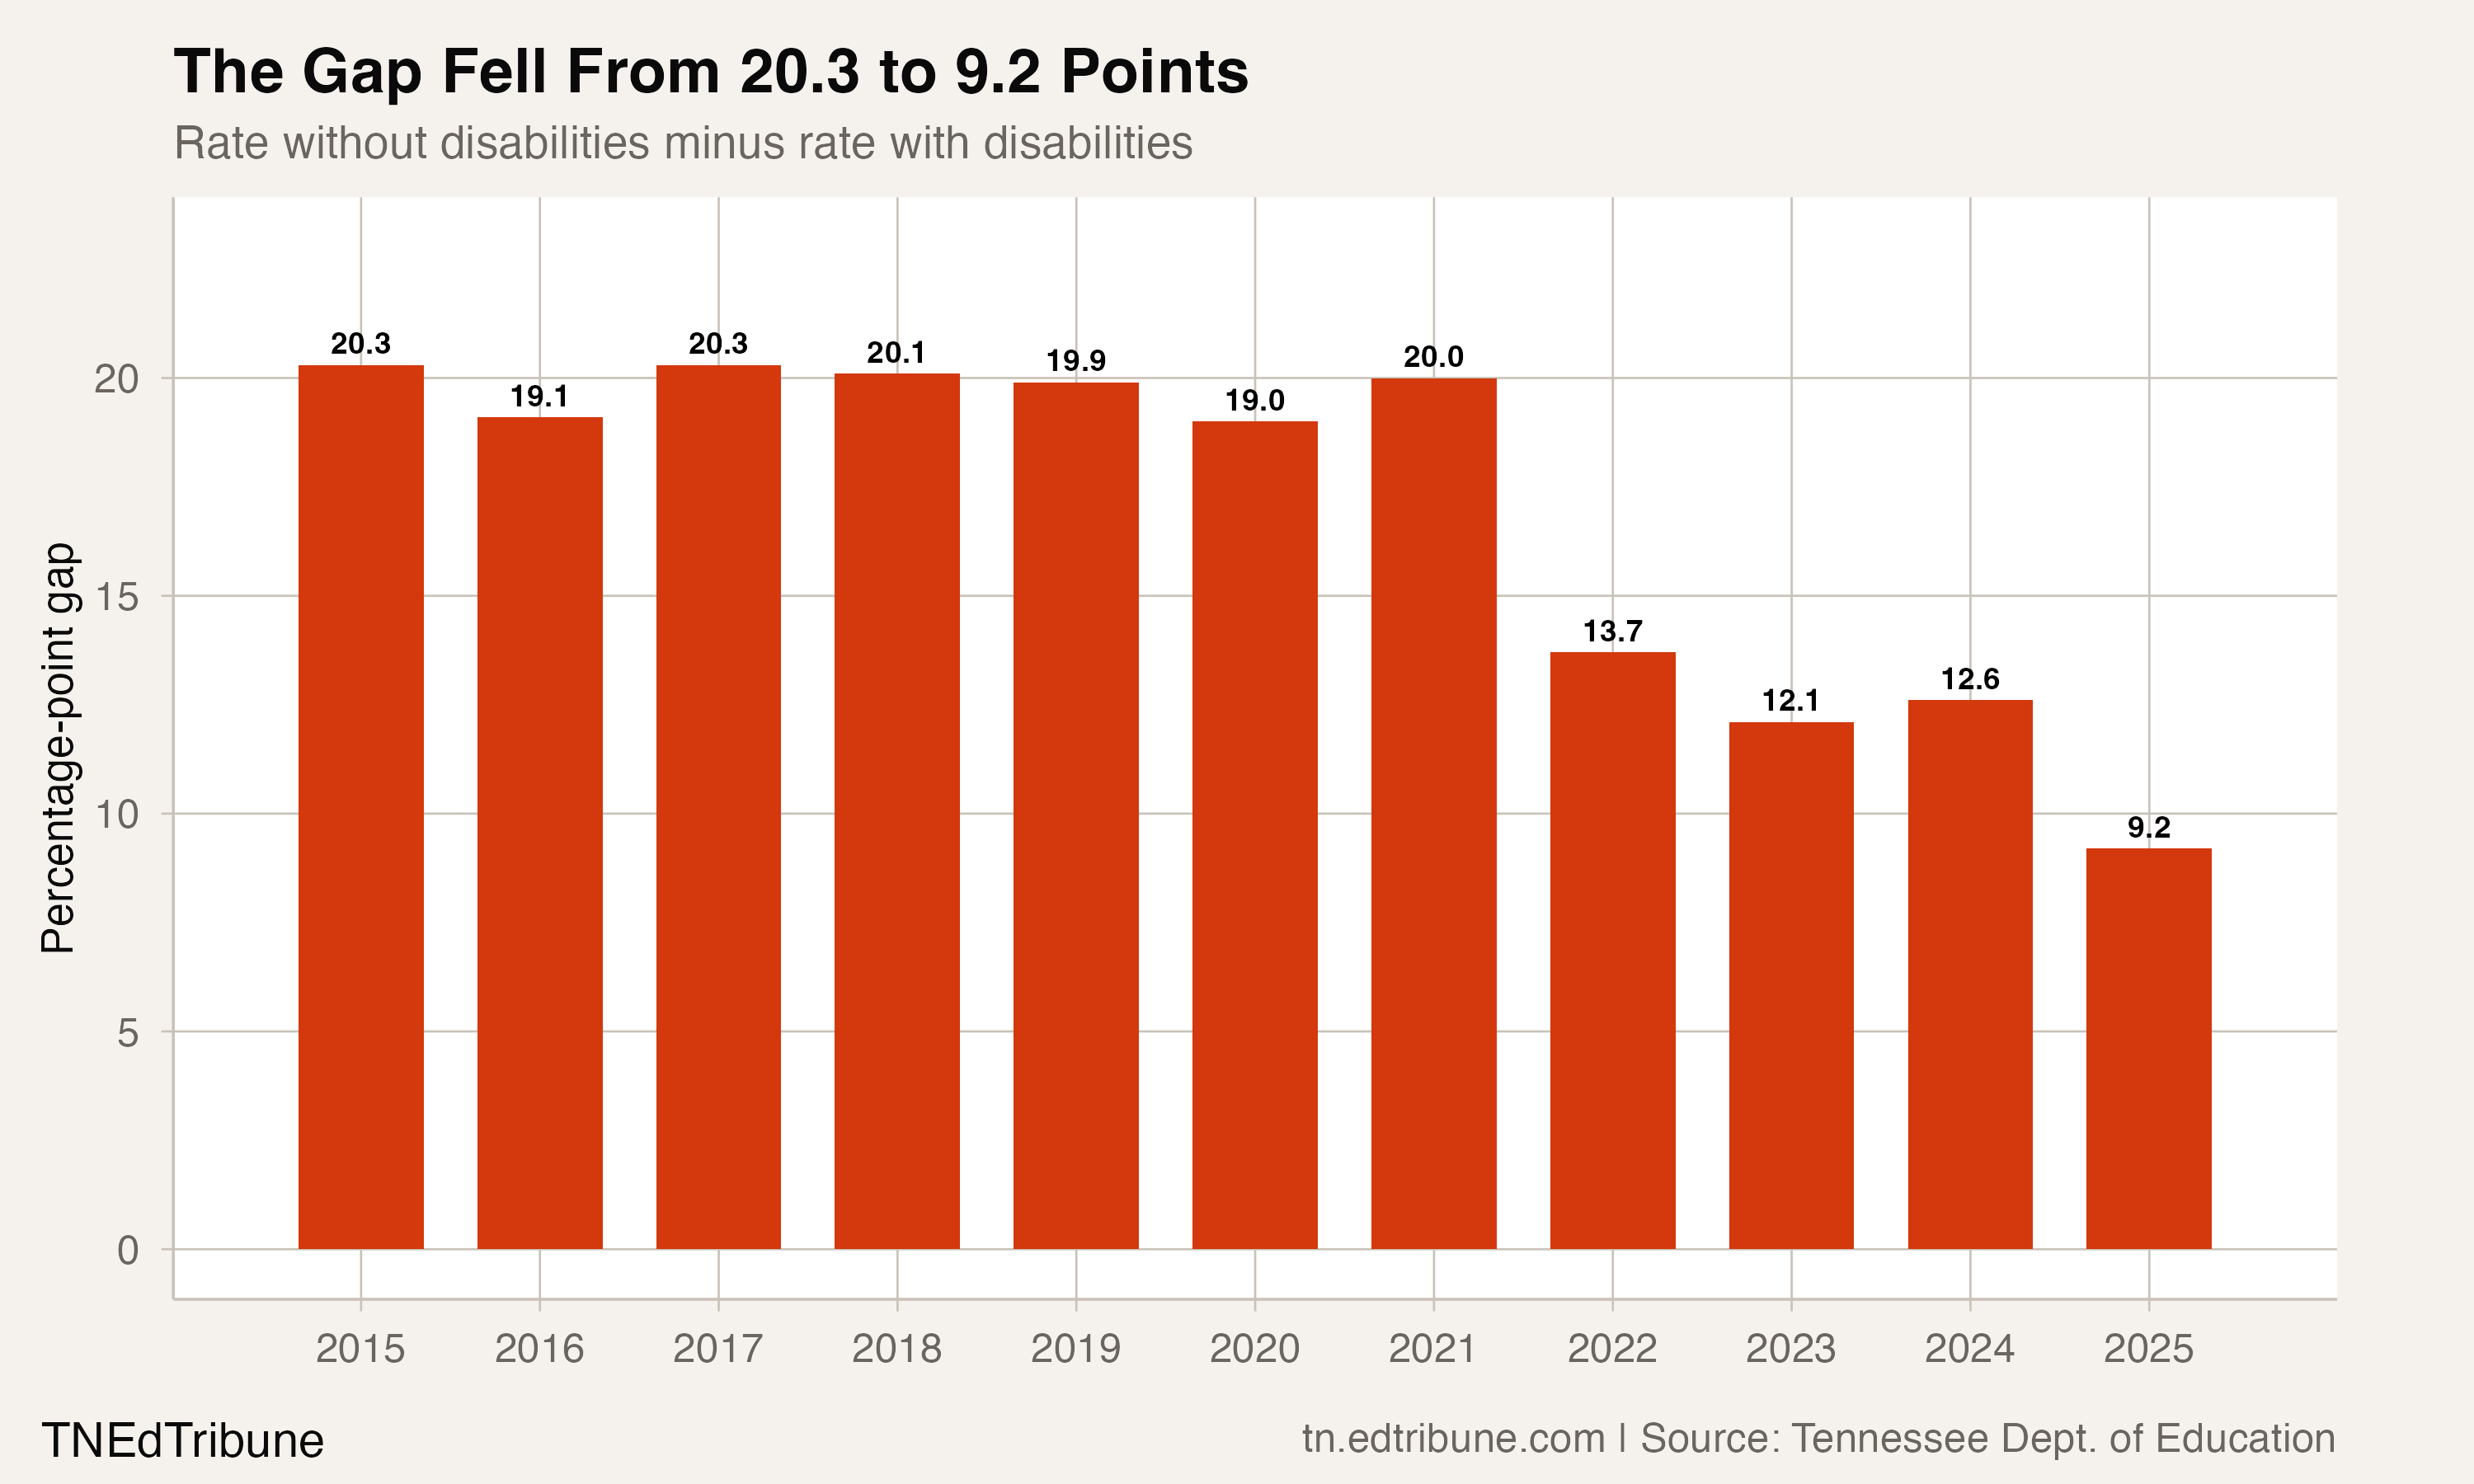
The path was not a steady year-by-year decline. The gap widened in three transitions—to 2017, 2021, and 2024—before reaching single digits for the first time in 2025.
The largest endpoint gain among state subgroups
Among the complete set of 21 statewide student groups with reported rates in both 2018 and 2025, special education had the largest endpoint increase at 12.6 points.
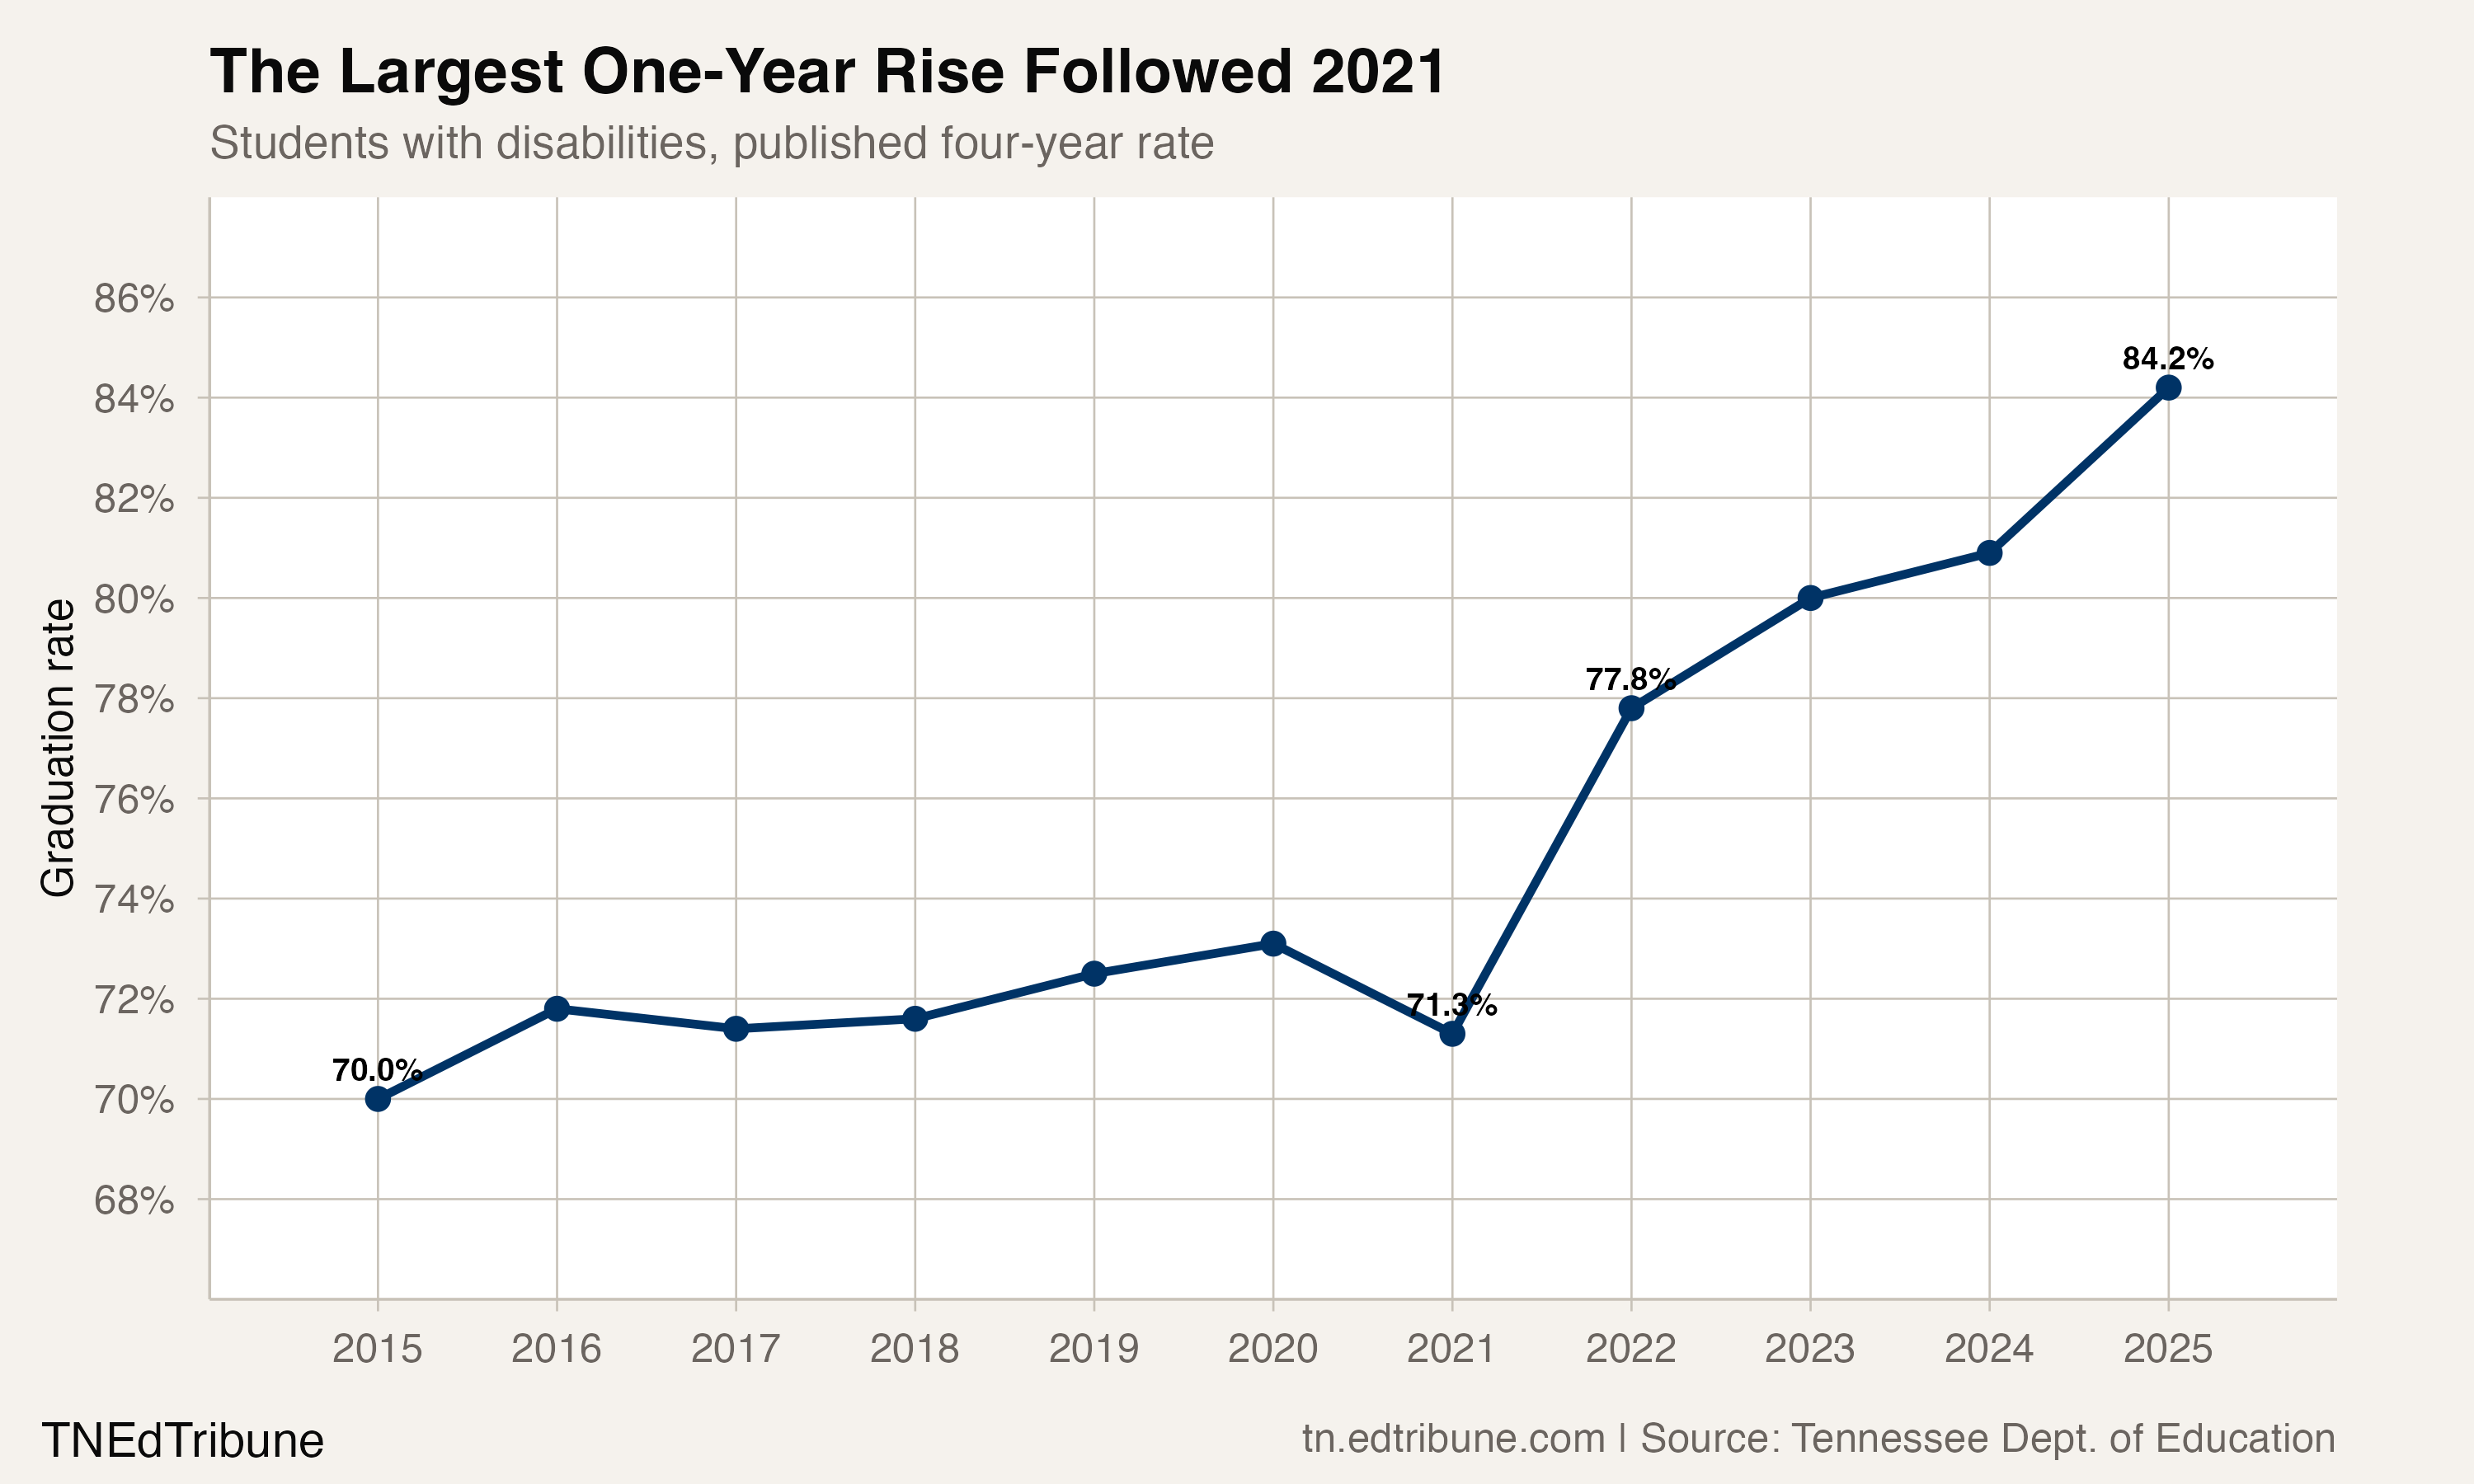
The annual special education rates were 70.0% in 2015, 71.8% in 2016, 71.4% in 2017, 71.6% in 2018, 72.5% in 2019, 73.1% in 2020, 71.3% in 2021, 77.8% in 2022, 80.0% in 2023, 80.9% in 2024, and 84.2% in 2025.
The special education rate declined in two of the ten year-to-year transitions, ending in 2017 and 2021. Its largest one-year rise was 6.5 points in 2022.
What 84.2% represents
Tennessee reported 8,663 students in the 2025 special education graduation cohort. Of those, 7,292 graduated and 1,371 did not graduate within the reported four-year outcome.
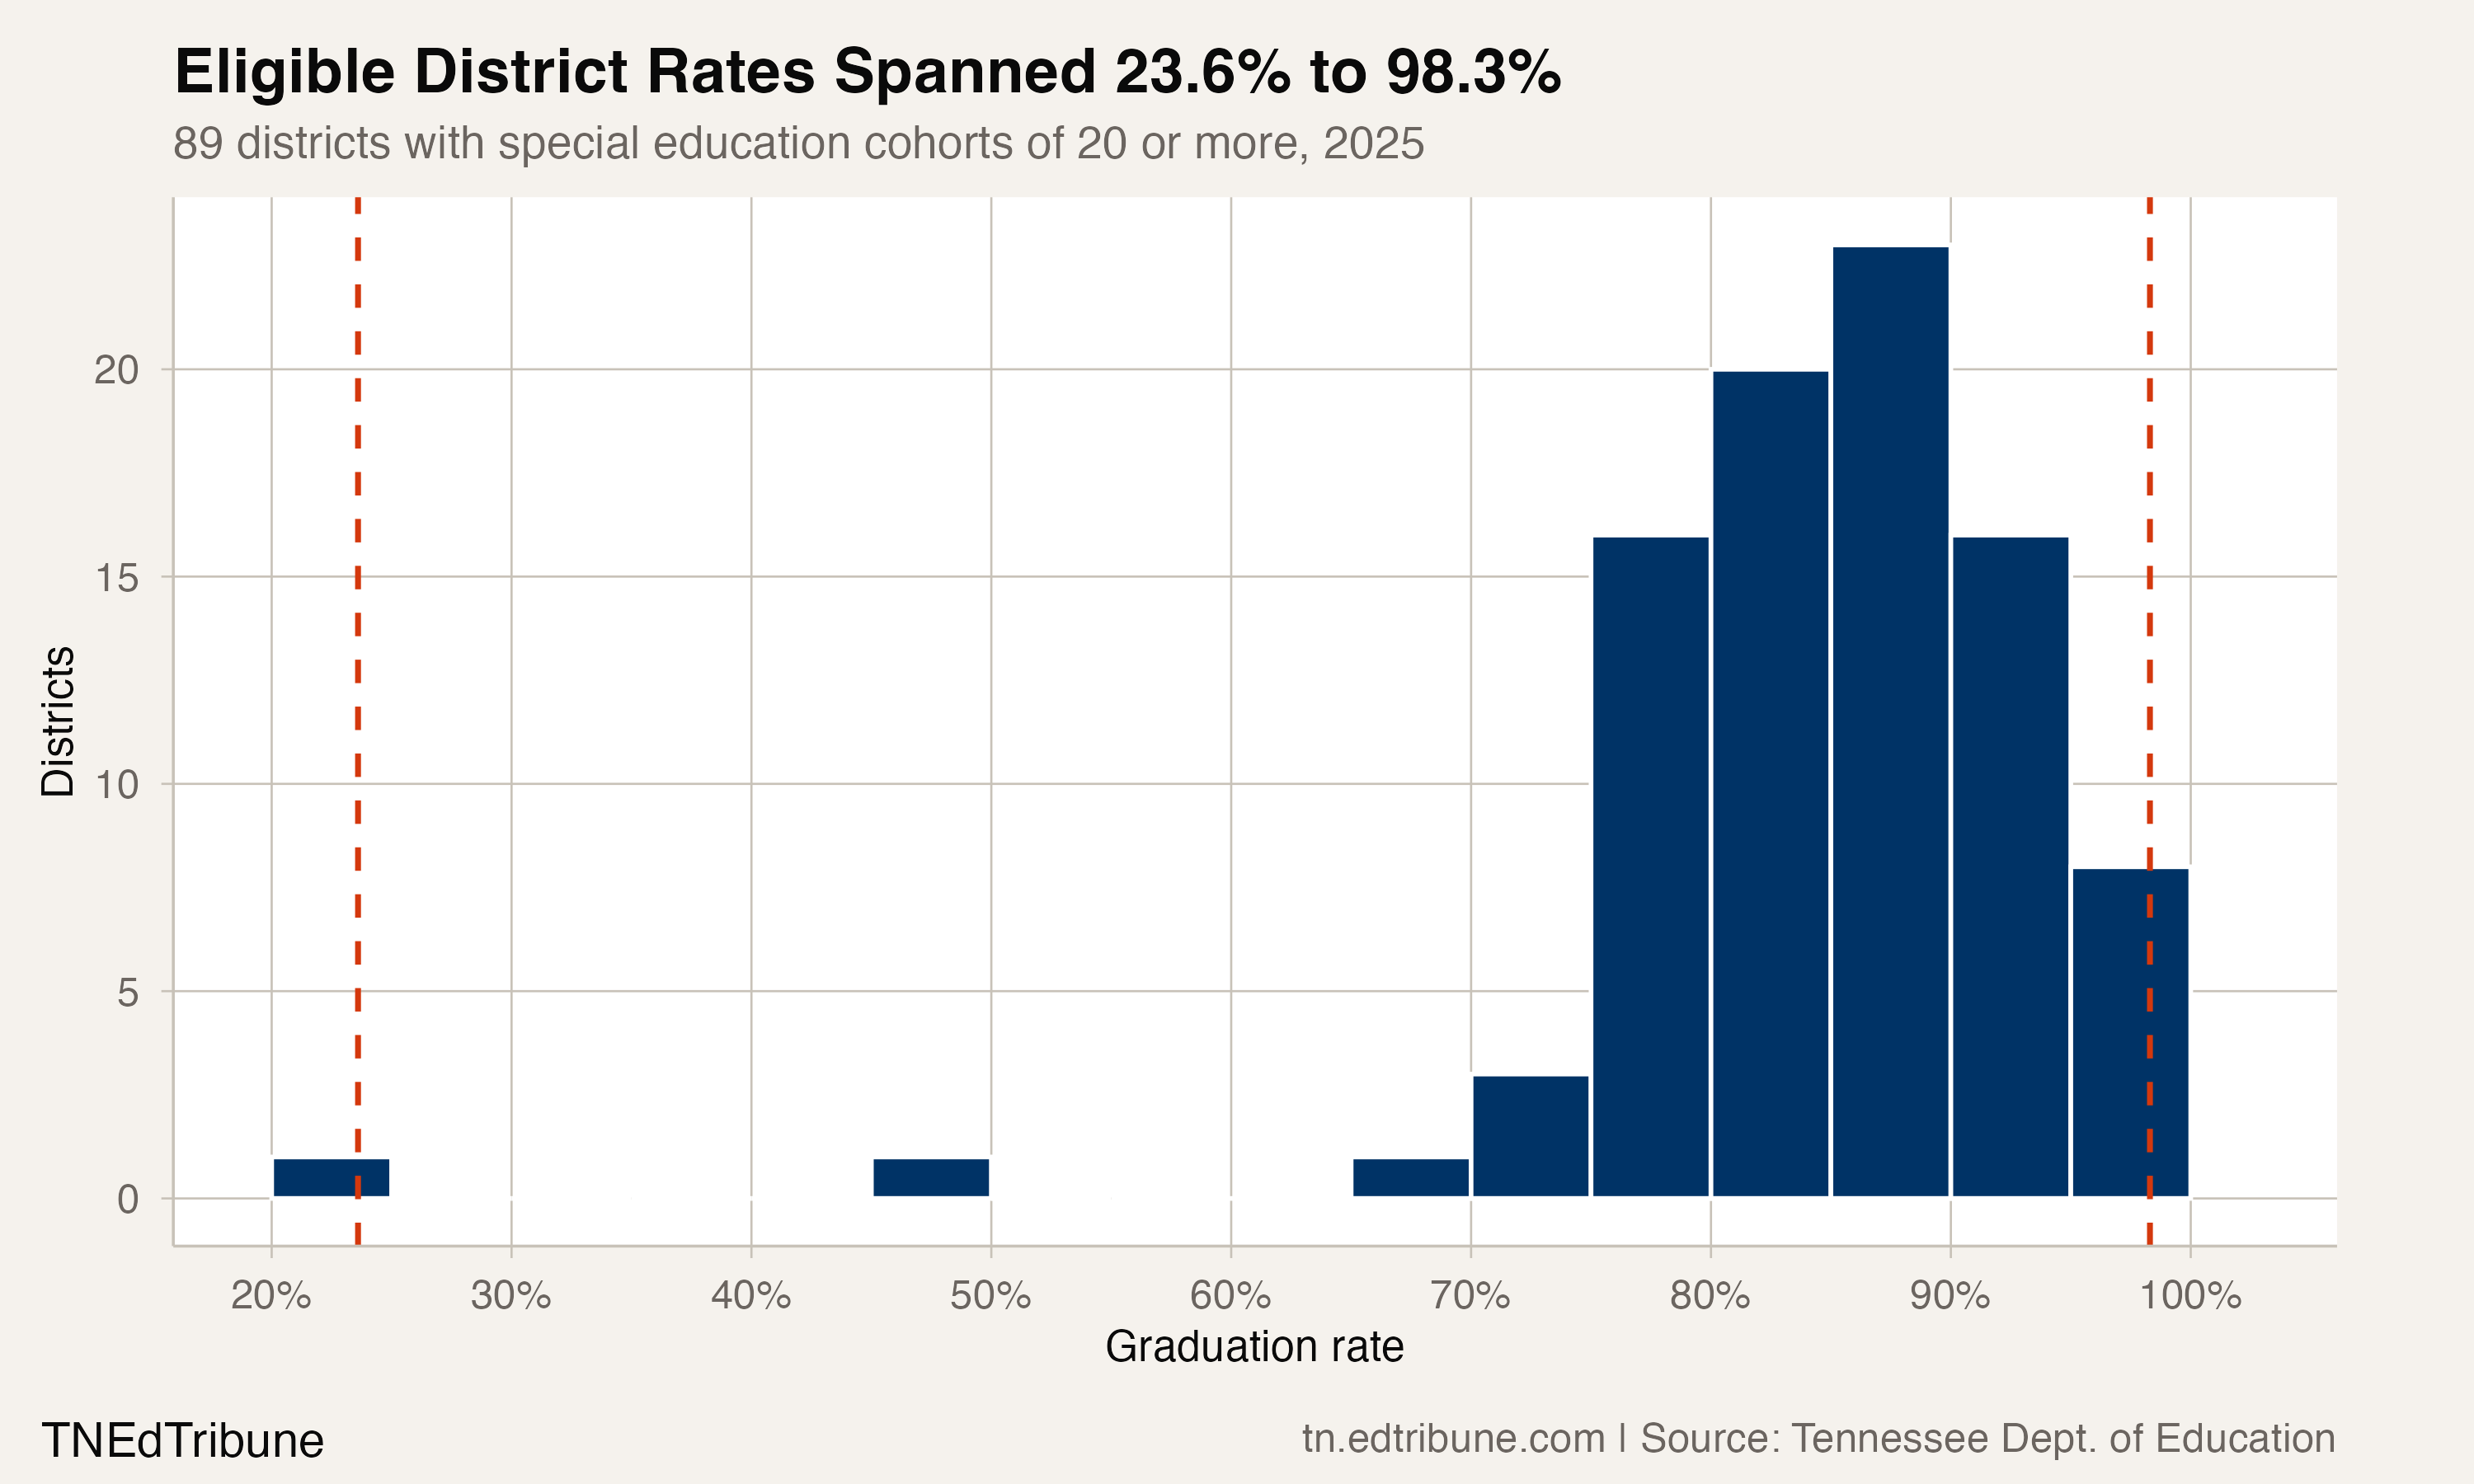
District results varied widely. Among 89 districts with at least 20 special education cohort members and a reported rate, Greene County ranked first at 98.3% for a cohort of 60, and Putnam County ranked second at 98.2% for a cohort of 112. The Department of Children's Services Education Division ranked 89th at 23.6% for a cohort of 165.
The files establish rates, counts, and comparisons. They do not show whether the statewide improvement resulted from instruction, policy, staffing, student classification, or another mechanism. Those explanations are unresourced here.
Graduation rates and cohort outcomes come from the Tennessee Department of Education's Data Downloads. The gap analysis uses every package year from 2015 through 2025 that reports both statewide disability groups.
Detailed code that reproduces the analysis and figures in this article is available exclusively to EdTribune subscribers.
Discussion
Sign in to join the discussion.
Loading comments...