Correction: This article was updated September 11, 2026, to correct the comparison window, district examples, subgroup rates, and supporting evidence.
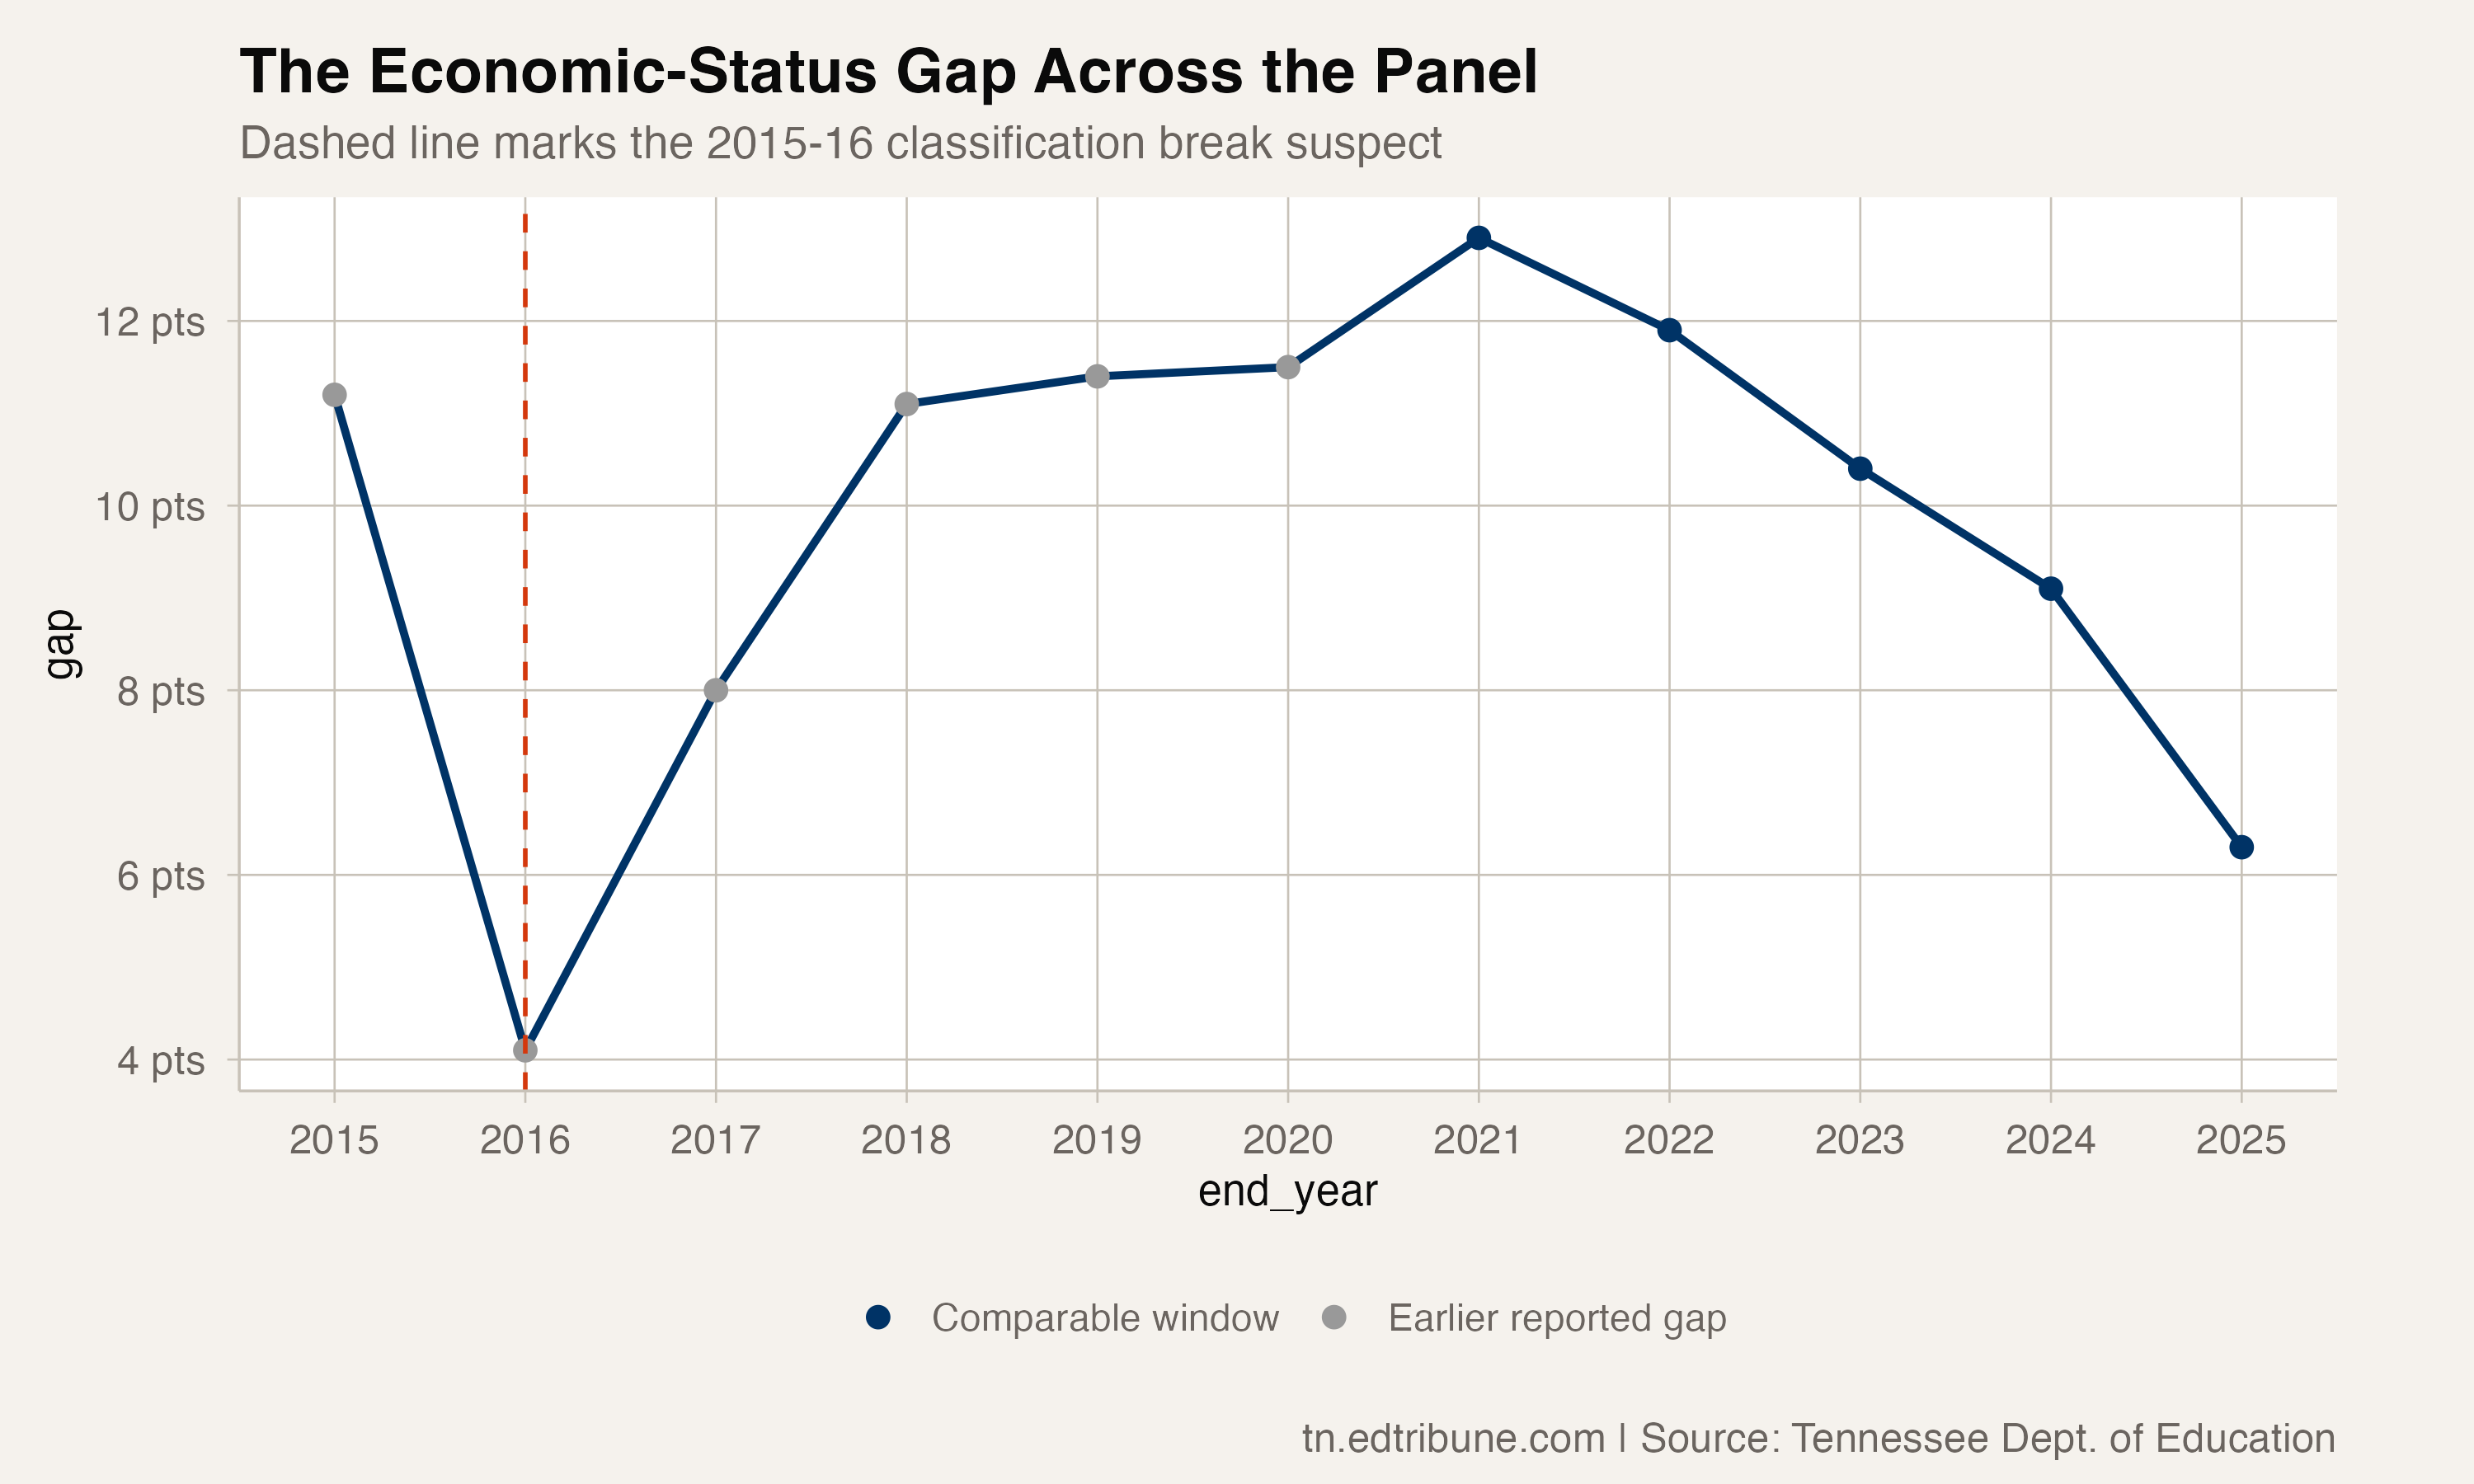
Tennessee's four-year graduation gap between students in the free/reduced-price lunch reporting group and other students narrowed from 12.9 percentage points in 2021 to 6.3 points in 2025. The gap shrank by 6.6 points, leaving it at 48.8% of its 2021 peak, a 51.2% reduction.
The change came mostly from the lower rate. Students in the free/reduced-price lunch group improved from 80.8% to 88.3%, a gain of 7.5 points. The other group moved from 93.7% to 94.6%, a gain of 0.9 points over the same four-year comparison.
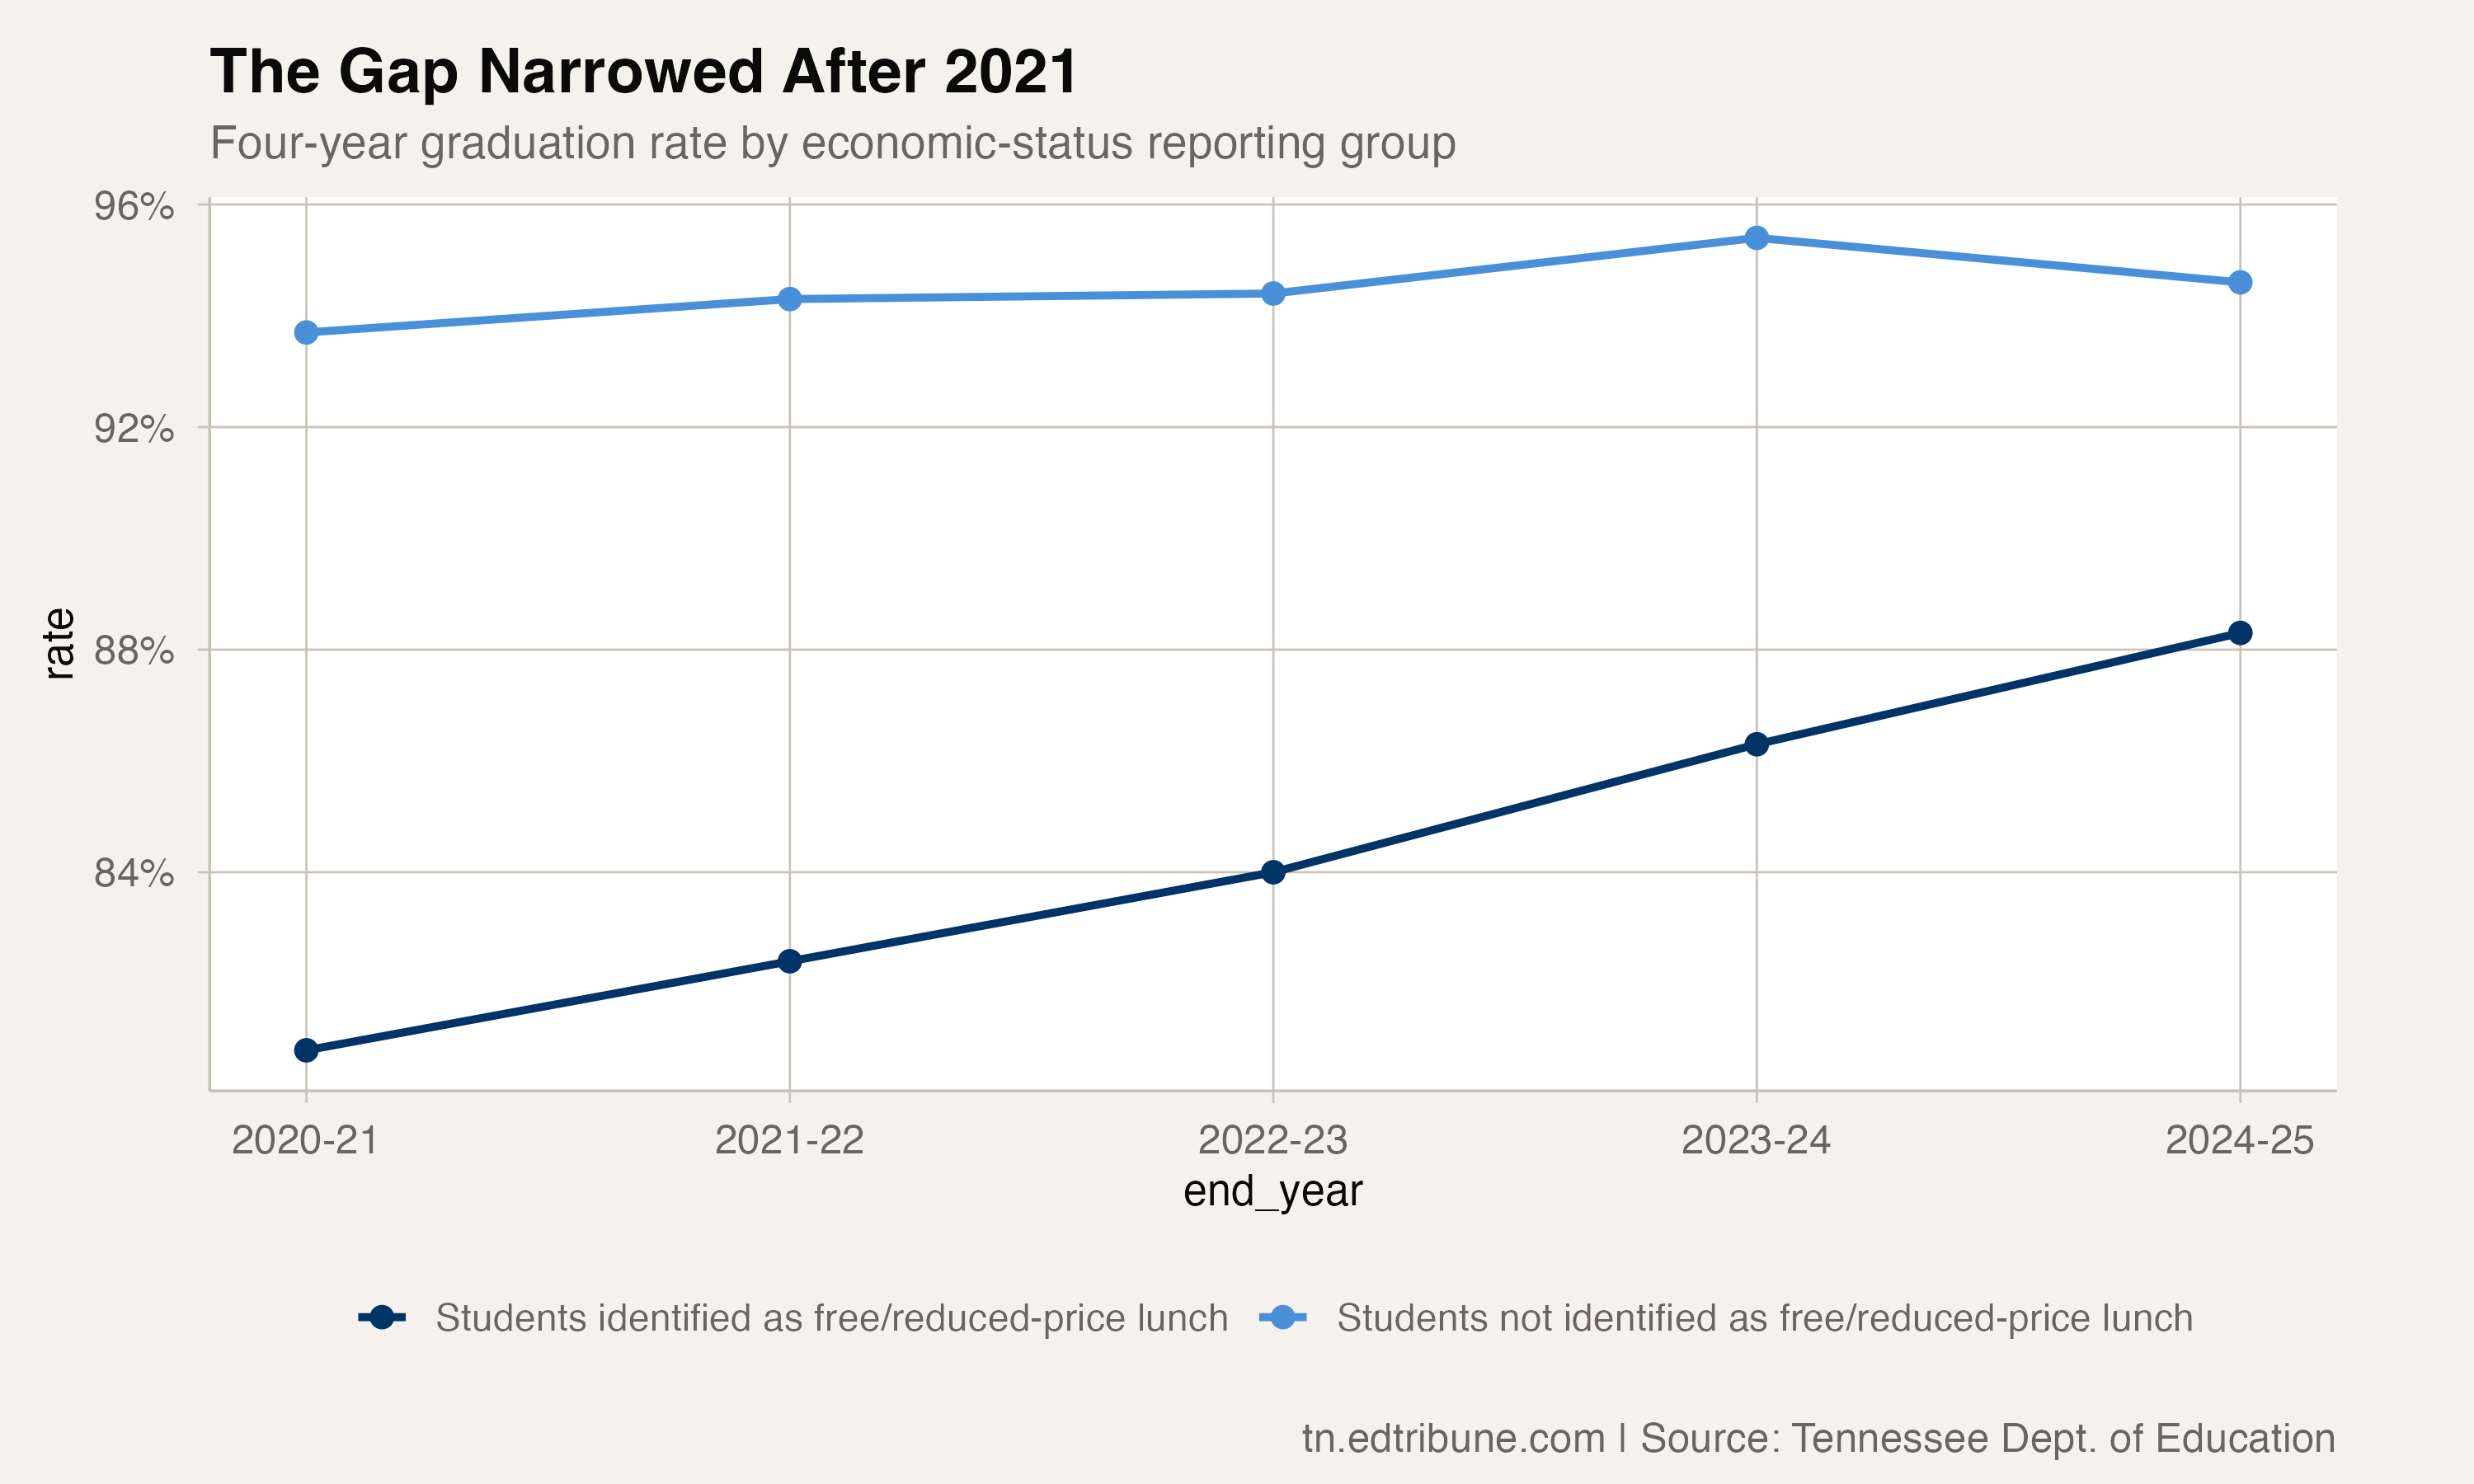
A comparable window after 2021
The state panel carries an important warning about earlier comparisons. The share of the graduating cohort in the free/reduced-price lunch reporting group changed sharply between 2015 and 2016. That means the 2016 gap is a reported value, but not a stable baseline for a continuous trend with 2015 or later years.
This article therefore uses 2021 through 2025 as its comparison window. Across those years, the identified group's share of the cohort shifted by 2.7 points. The analysis does not treat the earlier change as proof of a policy effect or a change in student need.
The statewide all-student graduation rate was 92.3% for the 2025 cohort, the highest value in the 2015-2025 panel. That statewide result sits alongside the narrower economic-status gap, but it does not explain what produced either outcome.
District differences remain
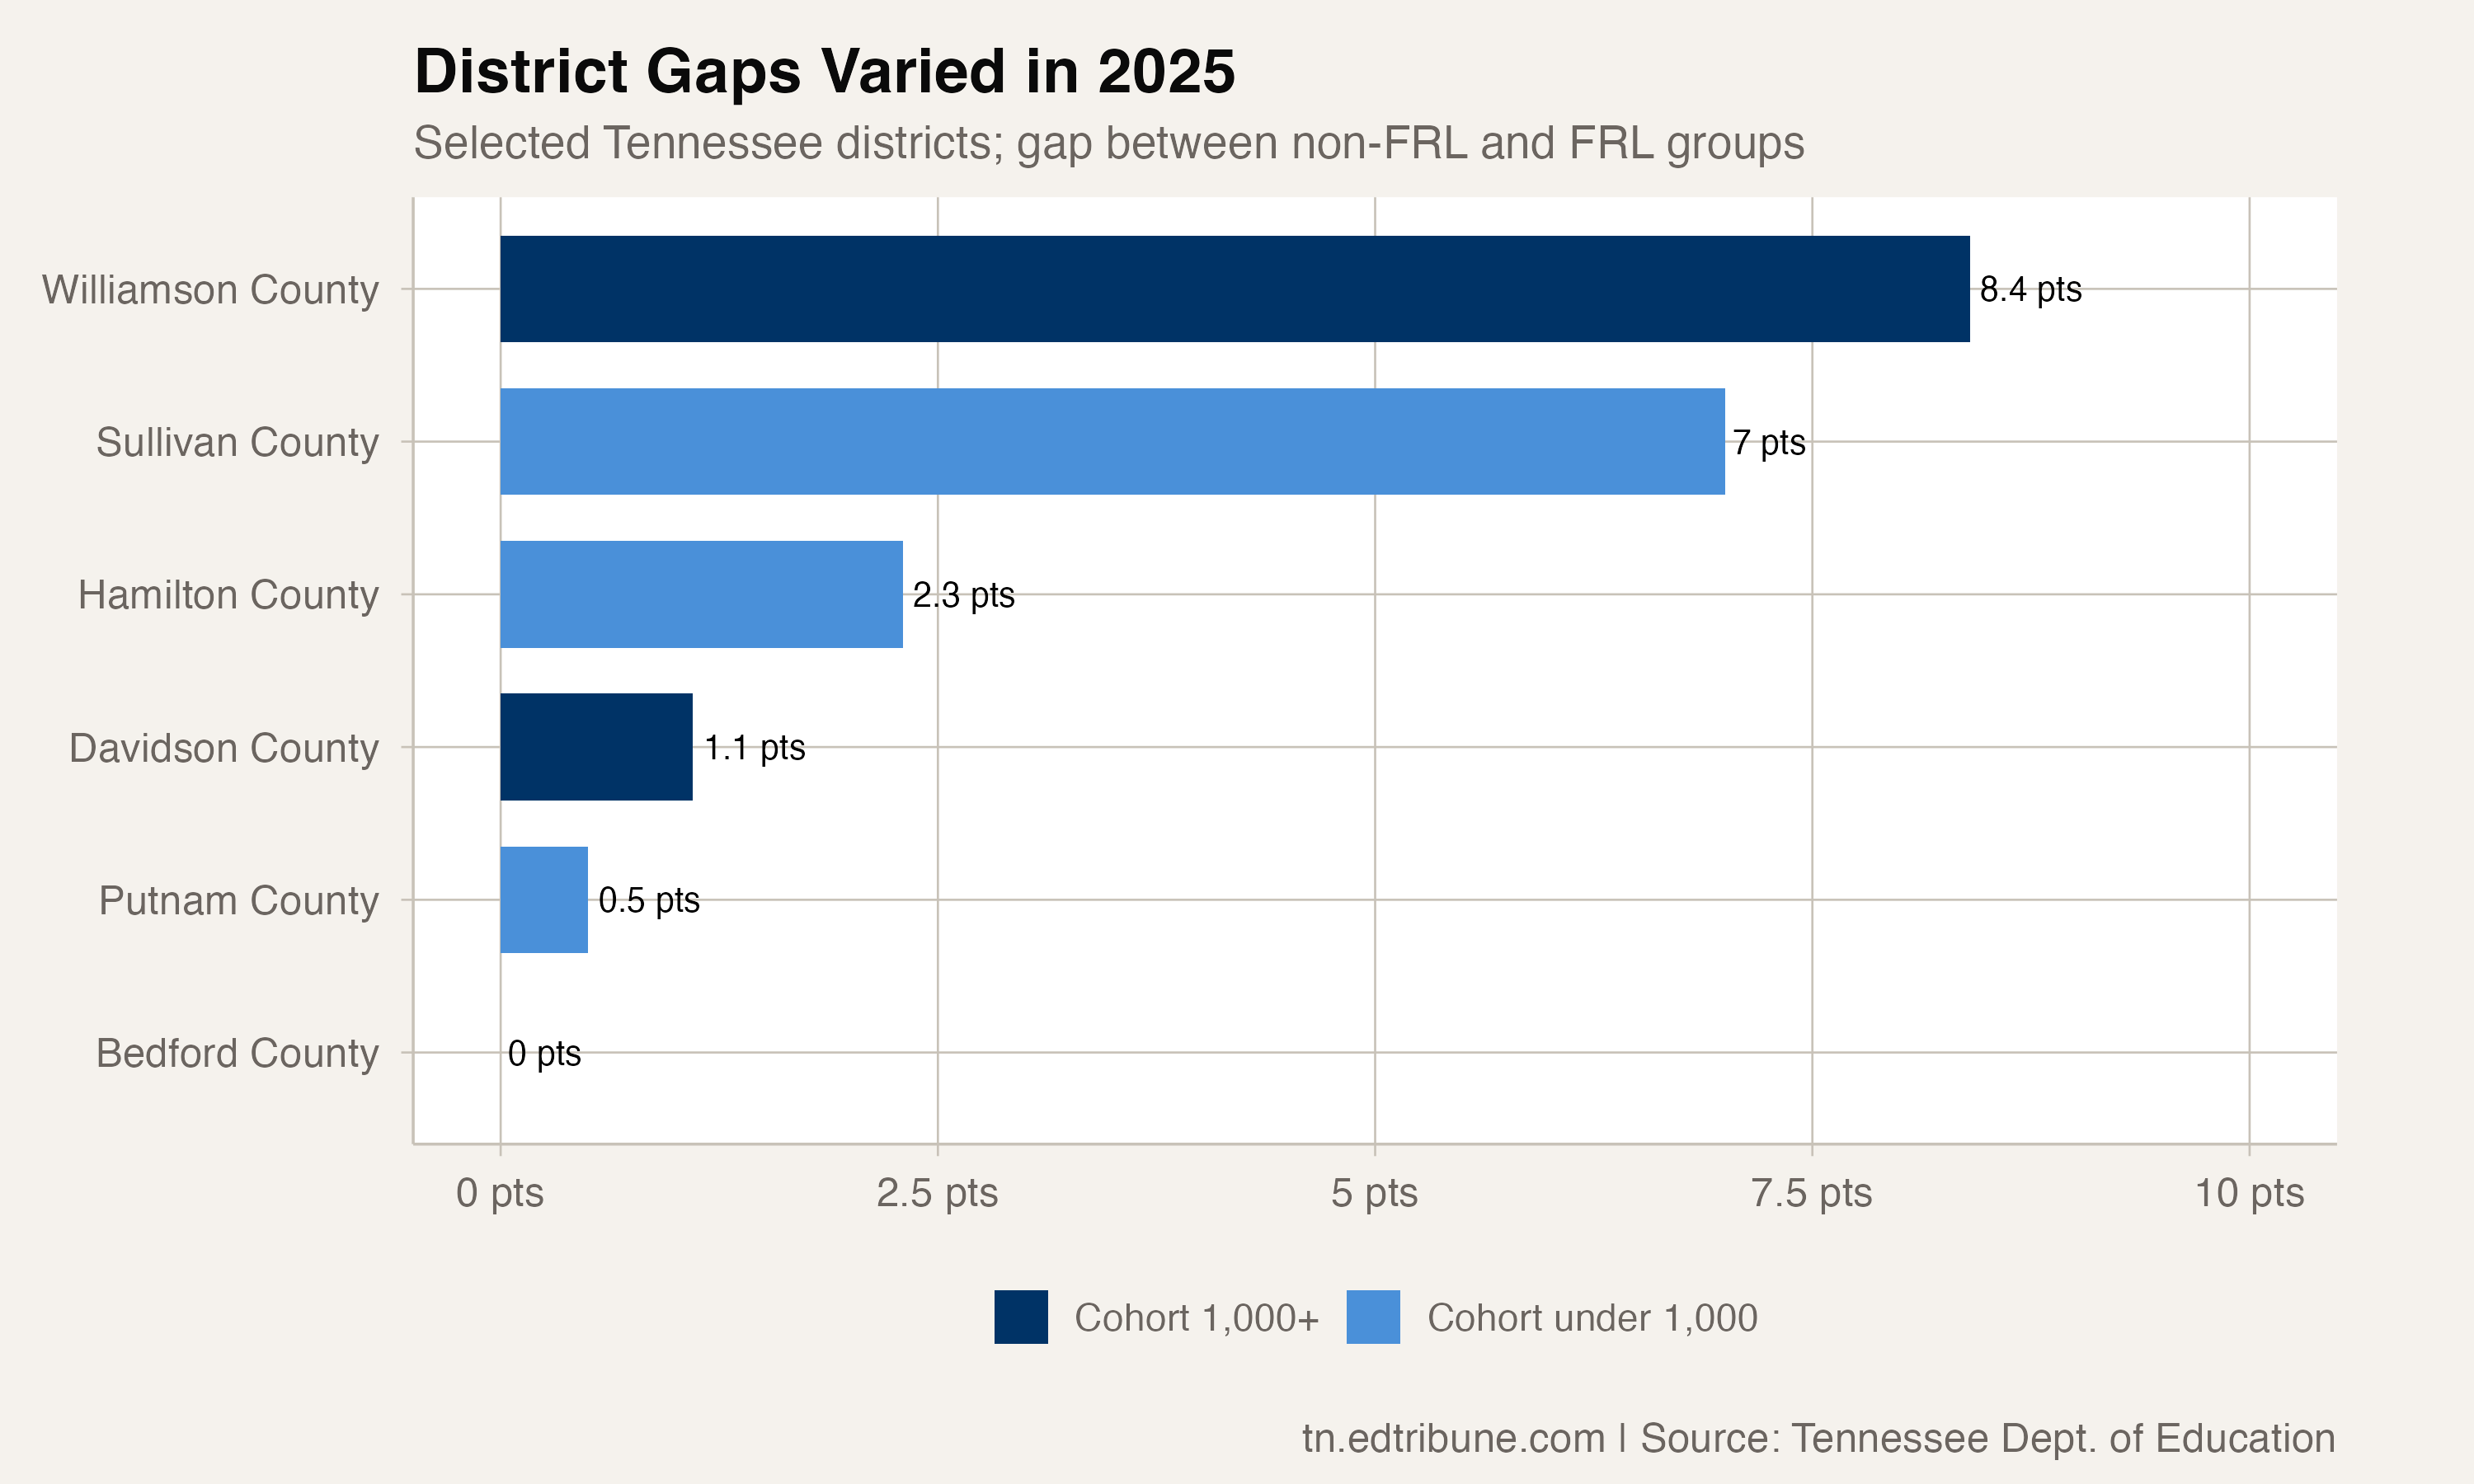
The statewide figure hides wide district variation. Among the 10 Tennessee districts with at least 1,000 students in the 2025 graduating cohort, Williamson County had the widest gap at 8.4 points. The cutoff is an editorial comparison group, not a state classification; smaller districts are shown separately in the chart.
Sullivan County's gap was 7.0 points. Hamilton County's was 2.3 points, while Davidson County's was 1.1. Putnam County's gap was 0.5 points and Bedford County's was 0.0 points. These comparisons describe the published 2025 rates; they do not establish why districts differ.
The clearest statewide signal is the movement after 2021: the free/reduced-price lunch group's rate rose faster than the rate for the other reporting group, and the measured gap narrowed with it. The remaining 6.3-point difference is still visible in the most recent published cohort, while the discontinuity earlier in the panel limits how far back the comparison can be carried.
Four-year graduation rates and cohort counts come from the Tennessee Department of Education's graduation data downloads. The analysis covers the 2015 through 2025 cohorts and uses the 2021-2025 period for the comparable-window comparison.
Detailed code that reproduces the analysis and figures in this article is available exclusively to EdTribune subscribers.
Discussion
Sign in to join the discussion.
Loading comments...