Tennessee's graduation rate reached 92.3% in 2025, the highest figure in the state's published series. Davidson County, which covers Nashville and has the state's second-largest graduating class, moved in the opposite direction. The district's rate fell from 85.7% to 83.6%, a 2.1-point drop that leaves Nashville 8.7 points below the state average.
The decline is not a blip in a long upward trajectory. Nashville's graduation rate has barely moved over the past decade, hovering between 80% and 82% for most of the period before a one-year jump to 85.7% in 2024 that now appears to have been an outlier rather than a turning point.
A decade of stagnation
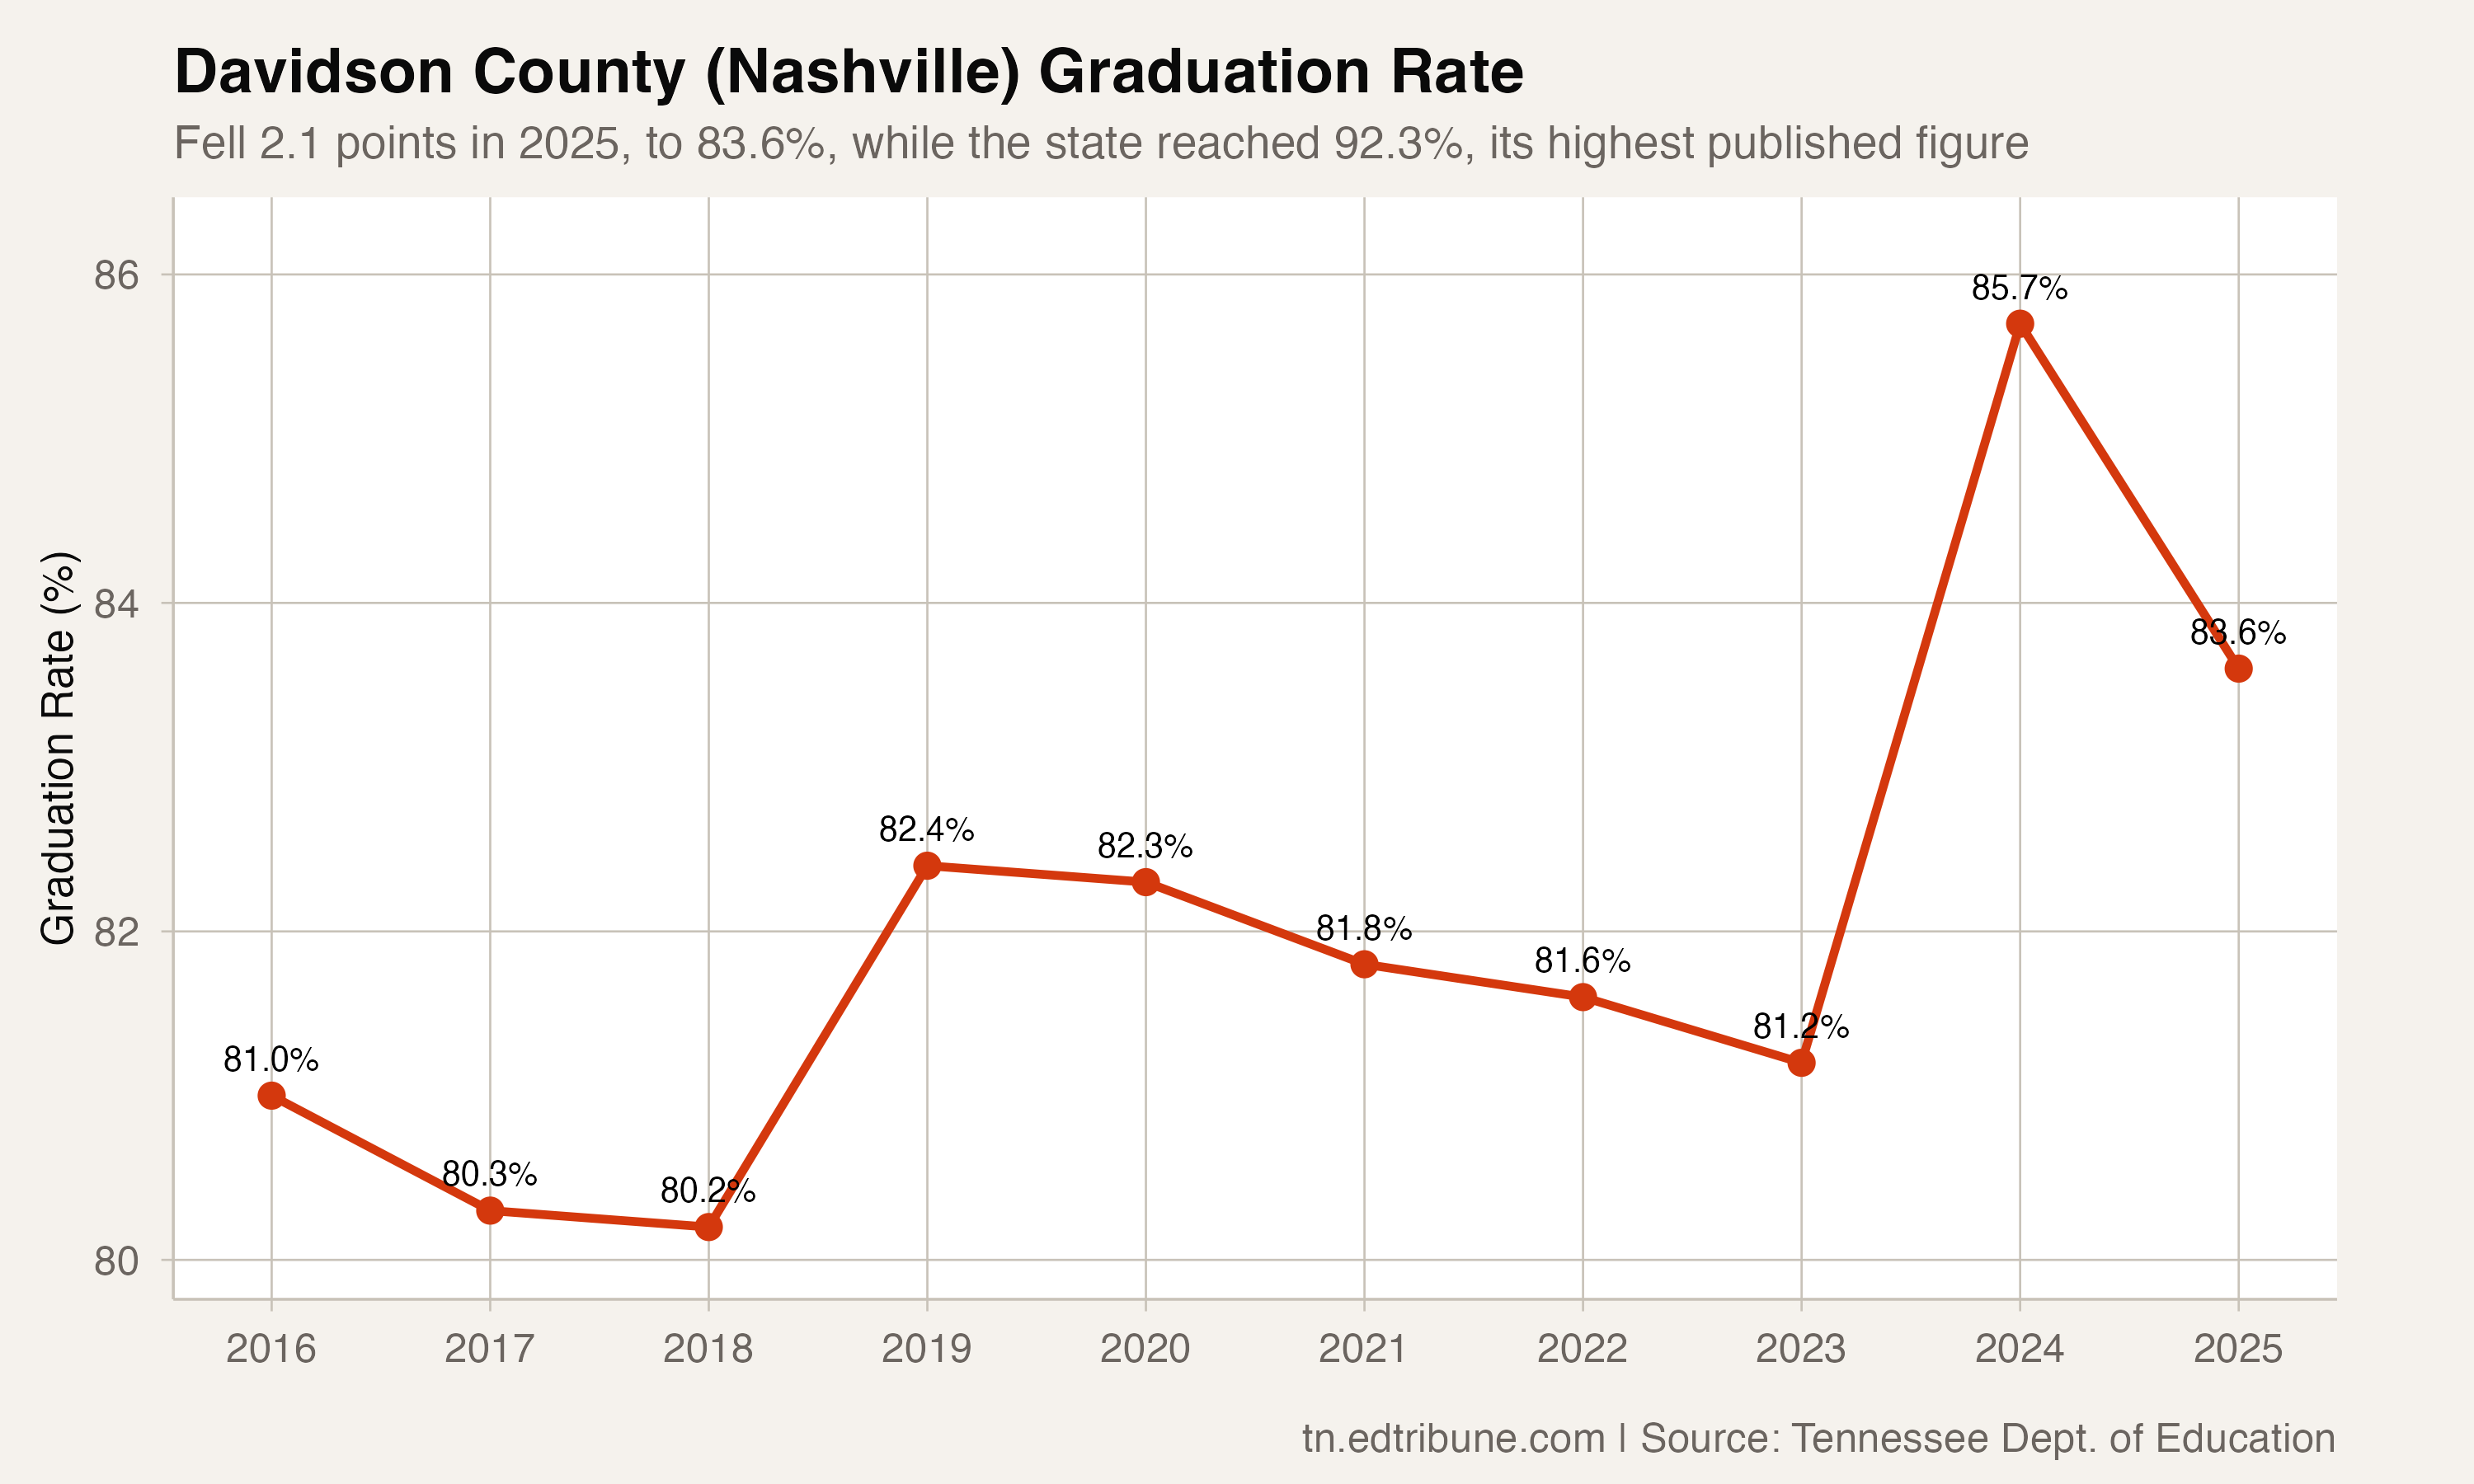
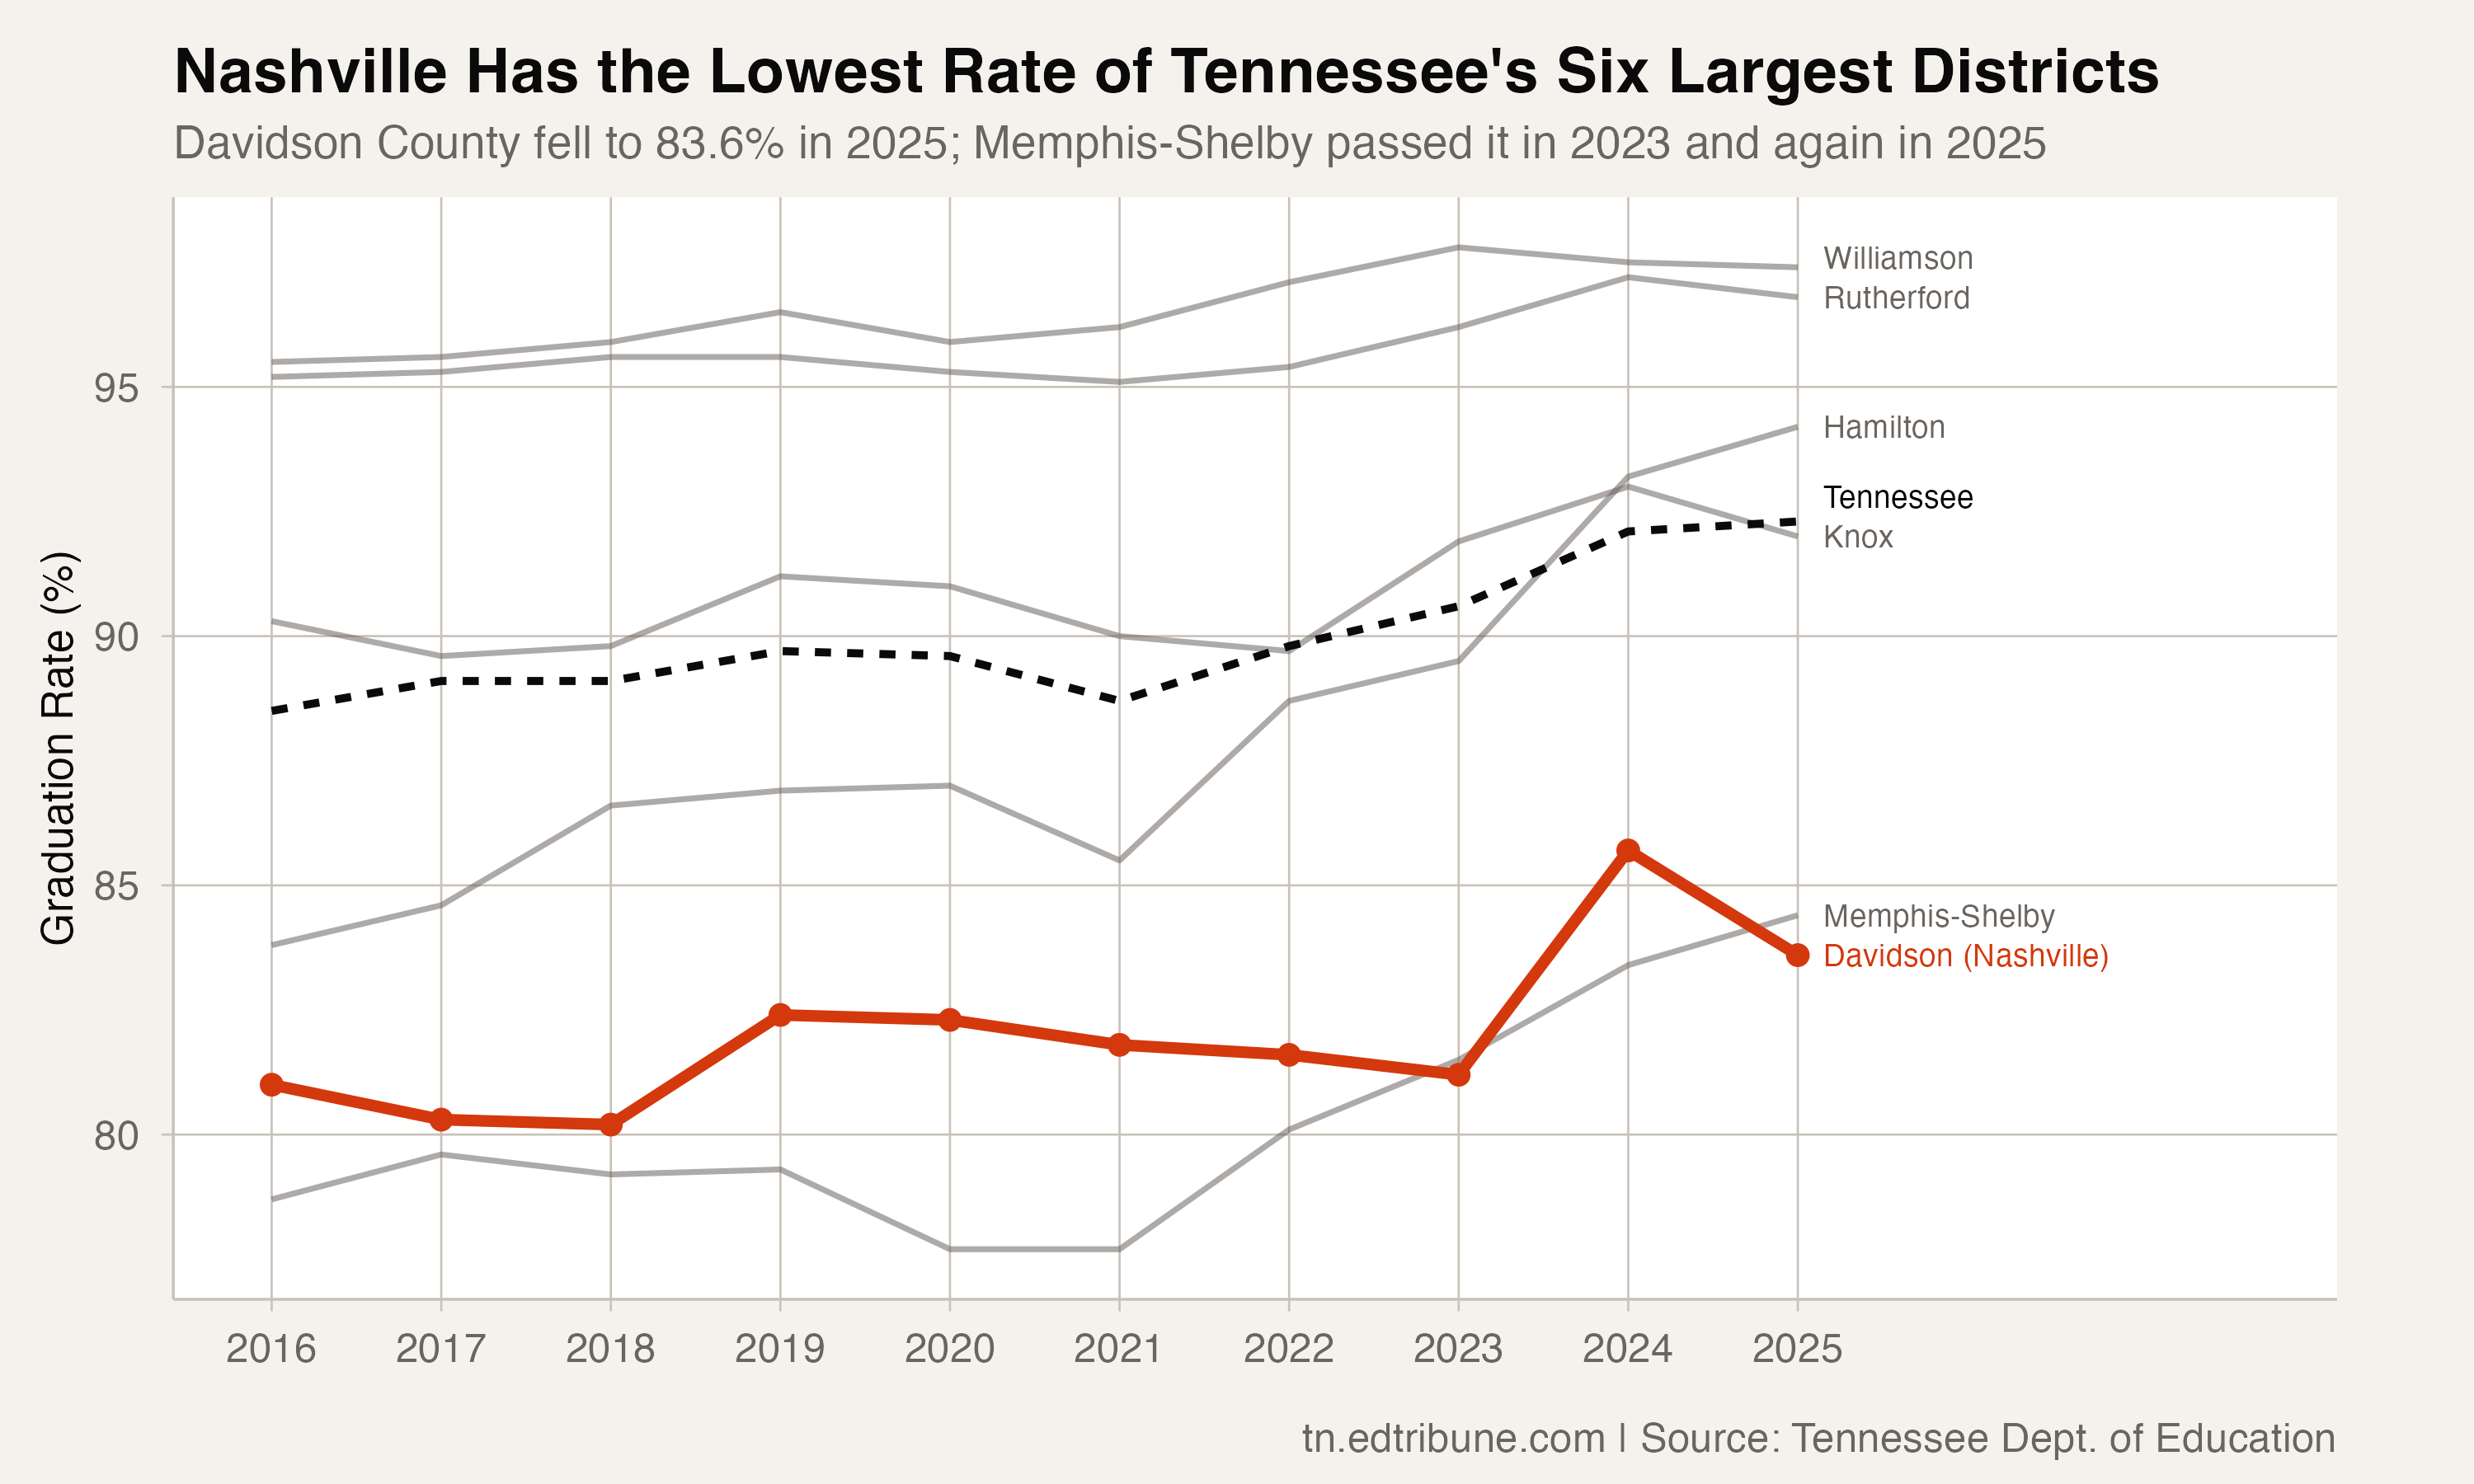
Nashville's graduation rate in 2016 was 81.0%. In 2025, it is 83.6%. Over the same 2016 to 2025 window the state gained 3.8 points, Hamilton County gained 10.4 points and Memphis-Shelby gained 5.7 points. Nashville gained 2.6 points, and most of that came from a single year's jump in 2024 that was largely reversed.
Among Tennessee's six largest districts by 2025 graduating class, Nashville now has the lowest rate. Memphis-Shelby at 84.4% sits about a point ahead; it first passed Nashville in 2023, fell behind again in 2024, and is ahead once more in 2025. Hamilton County is at 94.2% and Knox County at 92.0%, which is a shade below the statewide 92.3%. Rutherford County (96.8%) and Williamson County (97.4%), the other two districts in that group, are near the top of the state.
Nashville's 6,359-student cohort is the second largest in the state. Of those students, 5,313 graduated on time, leaving 1,046 who did not. Had the district matched the statewide 92.3%, roughly 490 students would have fallen short, about 556 fewer than the number who did.
Hispanic students and a fast-growing cohort
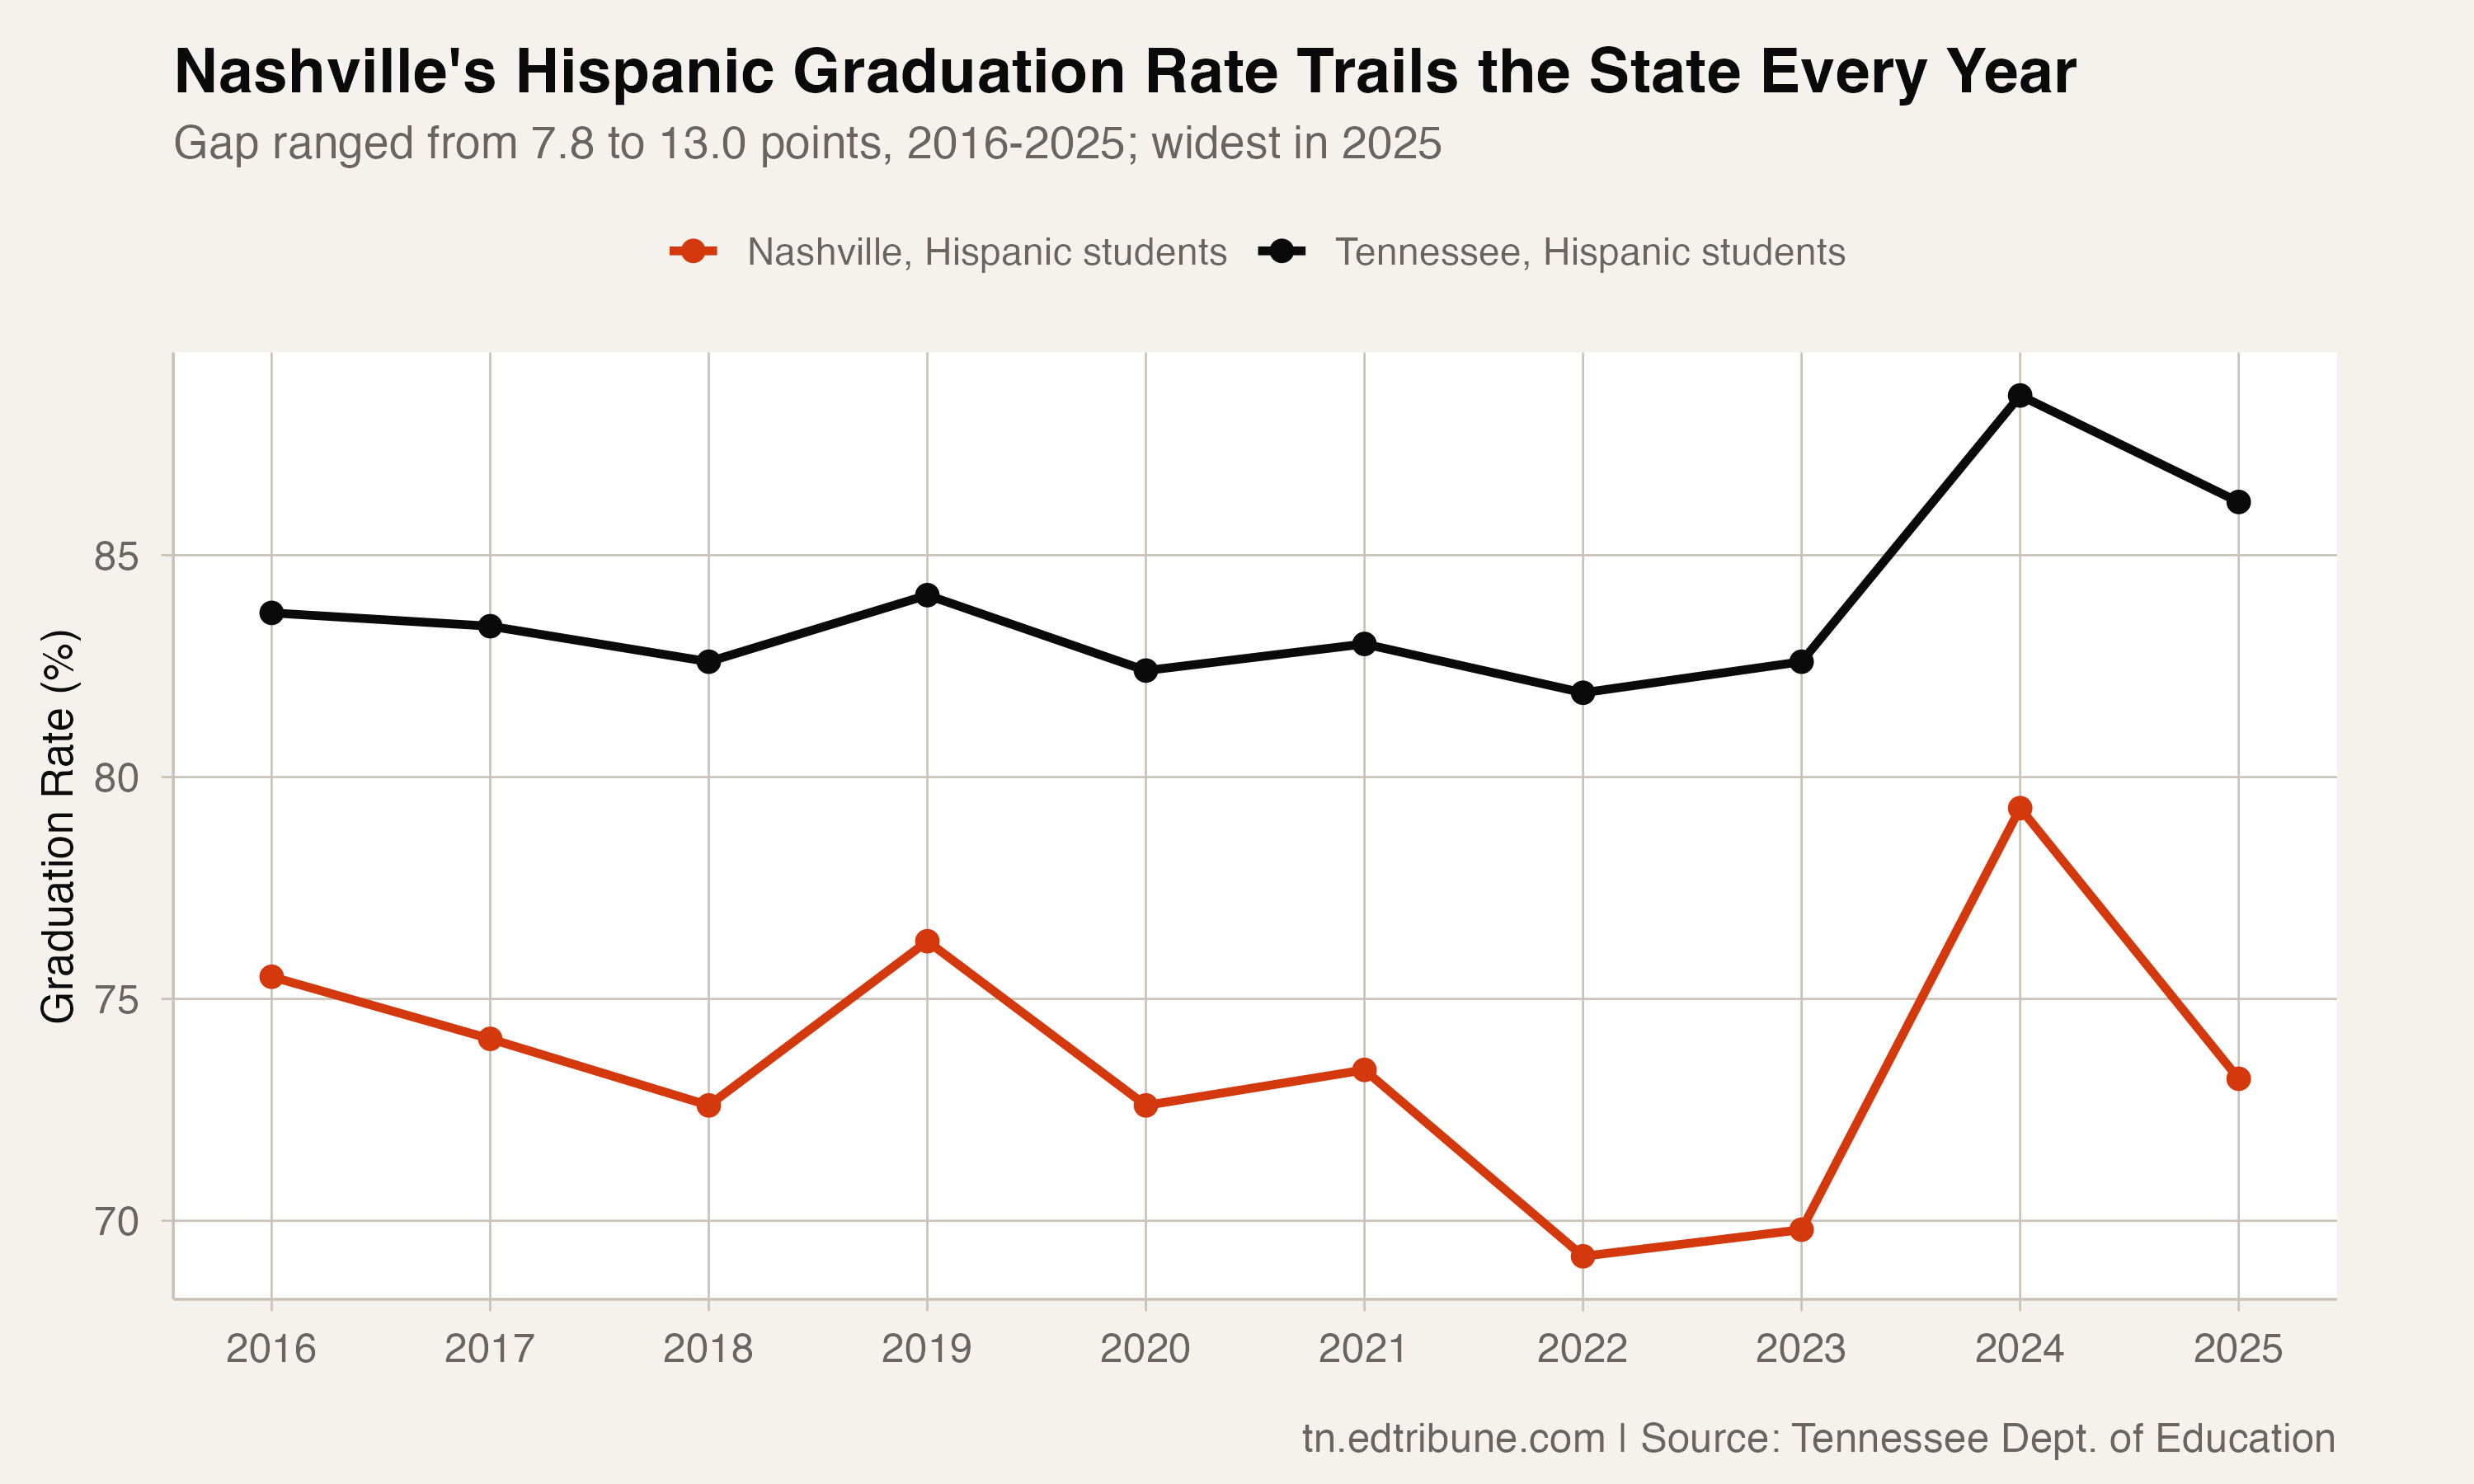
Hispanic students in Nashville graduated at 73.2% in 2025, down from 79.3% the year before. Across Tennessee's ten largest districts, that 6.1-point decline is the steepest one-year drop recorded for any racial or ethnic group. The next steepest is Hispanic students in Knox County, down 4.5 points.
The cohort itself grew sharply. Nashville's Hispanic graduating class went from 1,933 students in 2024 to 2,471 in 2025, an increase of 538 students, or 28%, in a single year. The number who graduated also rose, from 1,532 to 1,809, so the falling rate reflects a cohort that grew faster than the count of on-time graduates rather than fewer students finishing. At 2,471 students, Nashville's Hispanic cohort is larger than the entire graduating class of 124 of Tennessee's 131 districts.
Nashville's Hispanic rate has been below the statewide Hispanic rate in every year since 2016, by between 7.8 and 13.0 points. In 2022 it reached 69.2%, the lowest value in the published series. A partial recovery brought it to 79.3% in 2024, and the 2025 drop to 73.2% gave back about two-thirds of that gain.
What the data does not say is why the cohort grew. The published graduation file records cohort size and outcomes, not where students came from or when they enrolled, so a 28% increase is a fact to report and not, on its own, an explanation for the rate.
The rest of Nashville's 2025 results
Nashville's results vary widely by group. In 2025, the district's rates were:
- Asian students: 96.2% (211 students)
- White students: 92.0% (1,270 students)
- Black students: 88.6% (2,387 students)
- Students eligible for free or reduced-price lunch: 82.5% (2,807 students)
- Hispanic students: 73.2% (2,471 students)
Nashville's Black graduation rate of 88.6% exceeds Memphis-Shelby's 86.2%, so the district is not uniformly behind its largest peer. But Nashville's white rate of 92.0% also trails the statewide white rate of 95.1% by 3.1 points, so the shortfall is not confined to any one group.
The gap that keeps widening
In 2016, Nashville trailed the state average by 7.5 points (81.0% vs. 88.5%). In 2025, the gap has widened to 8.7 points (83.6% vs. 92.3%). As the state improves, Nashville falls further behind.
Hamilton County, Tennessee's other large urban district, offers the sharpest contrast. In 2016 Hamilton was at 83.8% and Nashville at 81.0%, a gap of 2.8 points. By 2025 Hamilton had reached 94.2% and Nashville 83.6%, a gap of 10.6 points. Hamilton's 10.4-point gain over that window is the largest of the six biggest districts, four times Nashville's 2.6 points. Three of those districts gained less than Nashville did, but Rutherford, Knox and Williamson all started at 90% or above in 2016 and had far less room to move; Nashville started at 81.0%.
The graduation file does not carry the information that would explain the difference. It reports cohort sizes and outcomes by district and by student group, not staffing, programs, budgets or student mobility. What it does establish is the size and direction of the gap: as Tennessee's rate has climbed, Nashville's has not kept pace, and the distance between the district and the state is wider now than it was in 2016.
Tennessee graduation rate data comes from the Tennessee Department of Education. Analysis covers the 2015-16 through 2024-25 school years (10 cohorts). All rates are 4-year adjusted cohort graduation rates.
Detailed code that reproduces the analysis and figures in this article is available exclusively to EdTribune subscribers.
Discussion
Sign in to join the discussion.
Loading comments...